
MD Maps: a cadastre that works like a tool
Find out everything about any parcel in Montenegro: who owns it, whether it carries debts or encumbrances, and what it's worth. Live data from the eKatastar state registry, market analytics and pro tools — from buyers to surveyors and appraisers.
- 4
- languages
- Live
- eKatastar
- 360°
- parcel
- API
- for partners
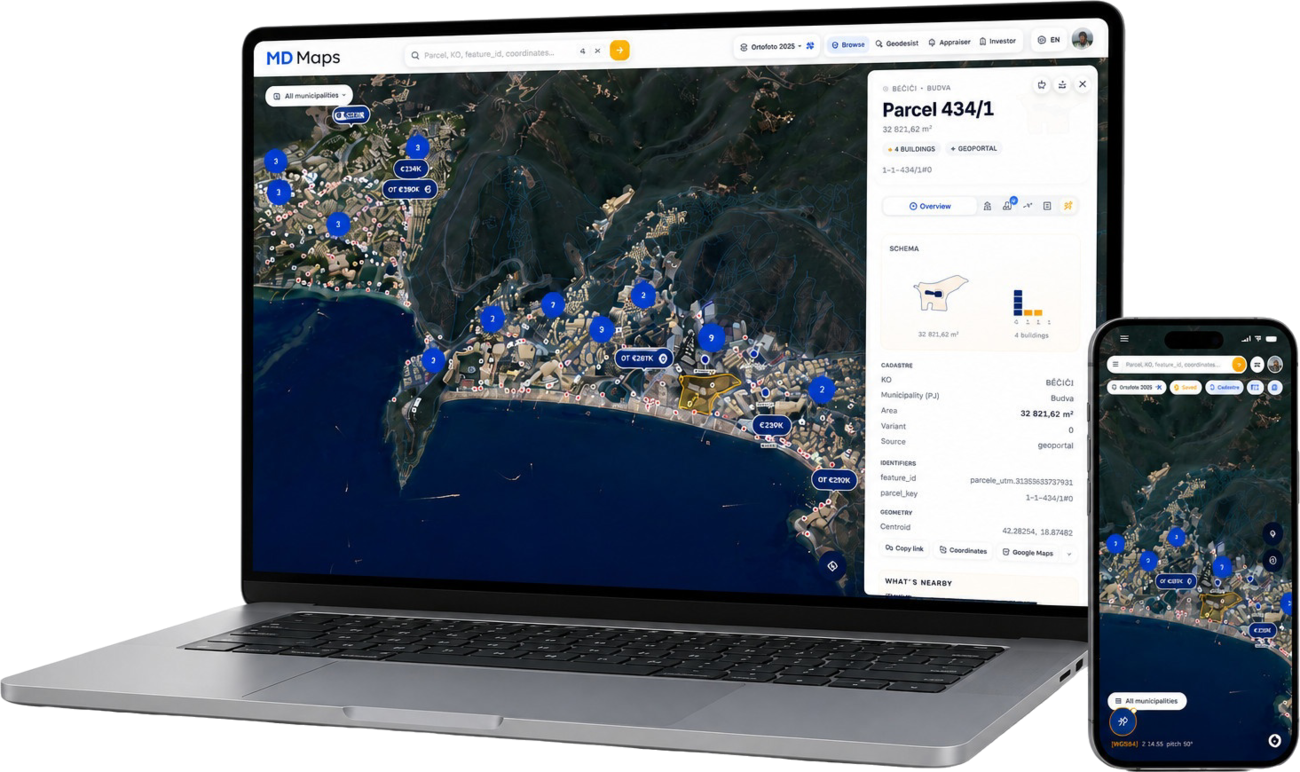
One point — several layers of reality
Orthophoto, cadastre, prices, heatmap and 3D volumes — all in the same frame. Layers cycle on their own; hover (or tap the indicator) to hold the one you need.
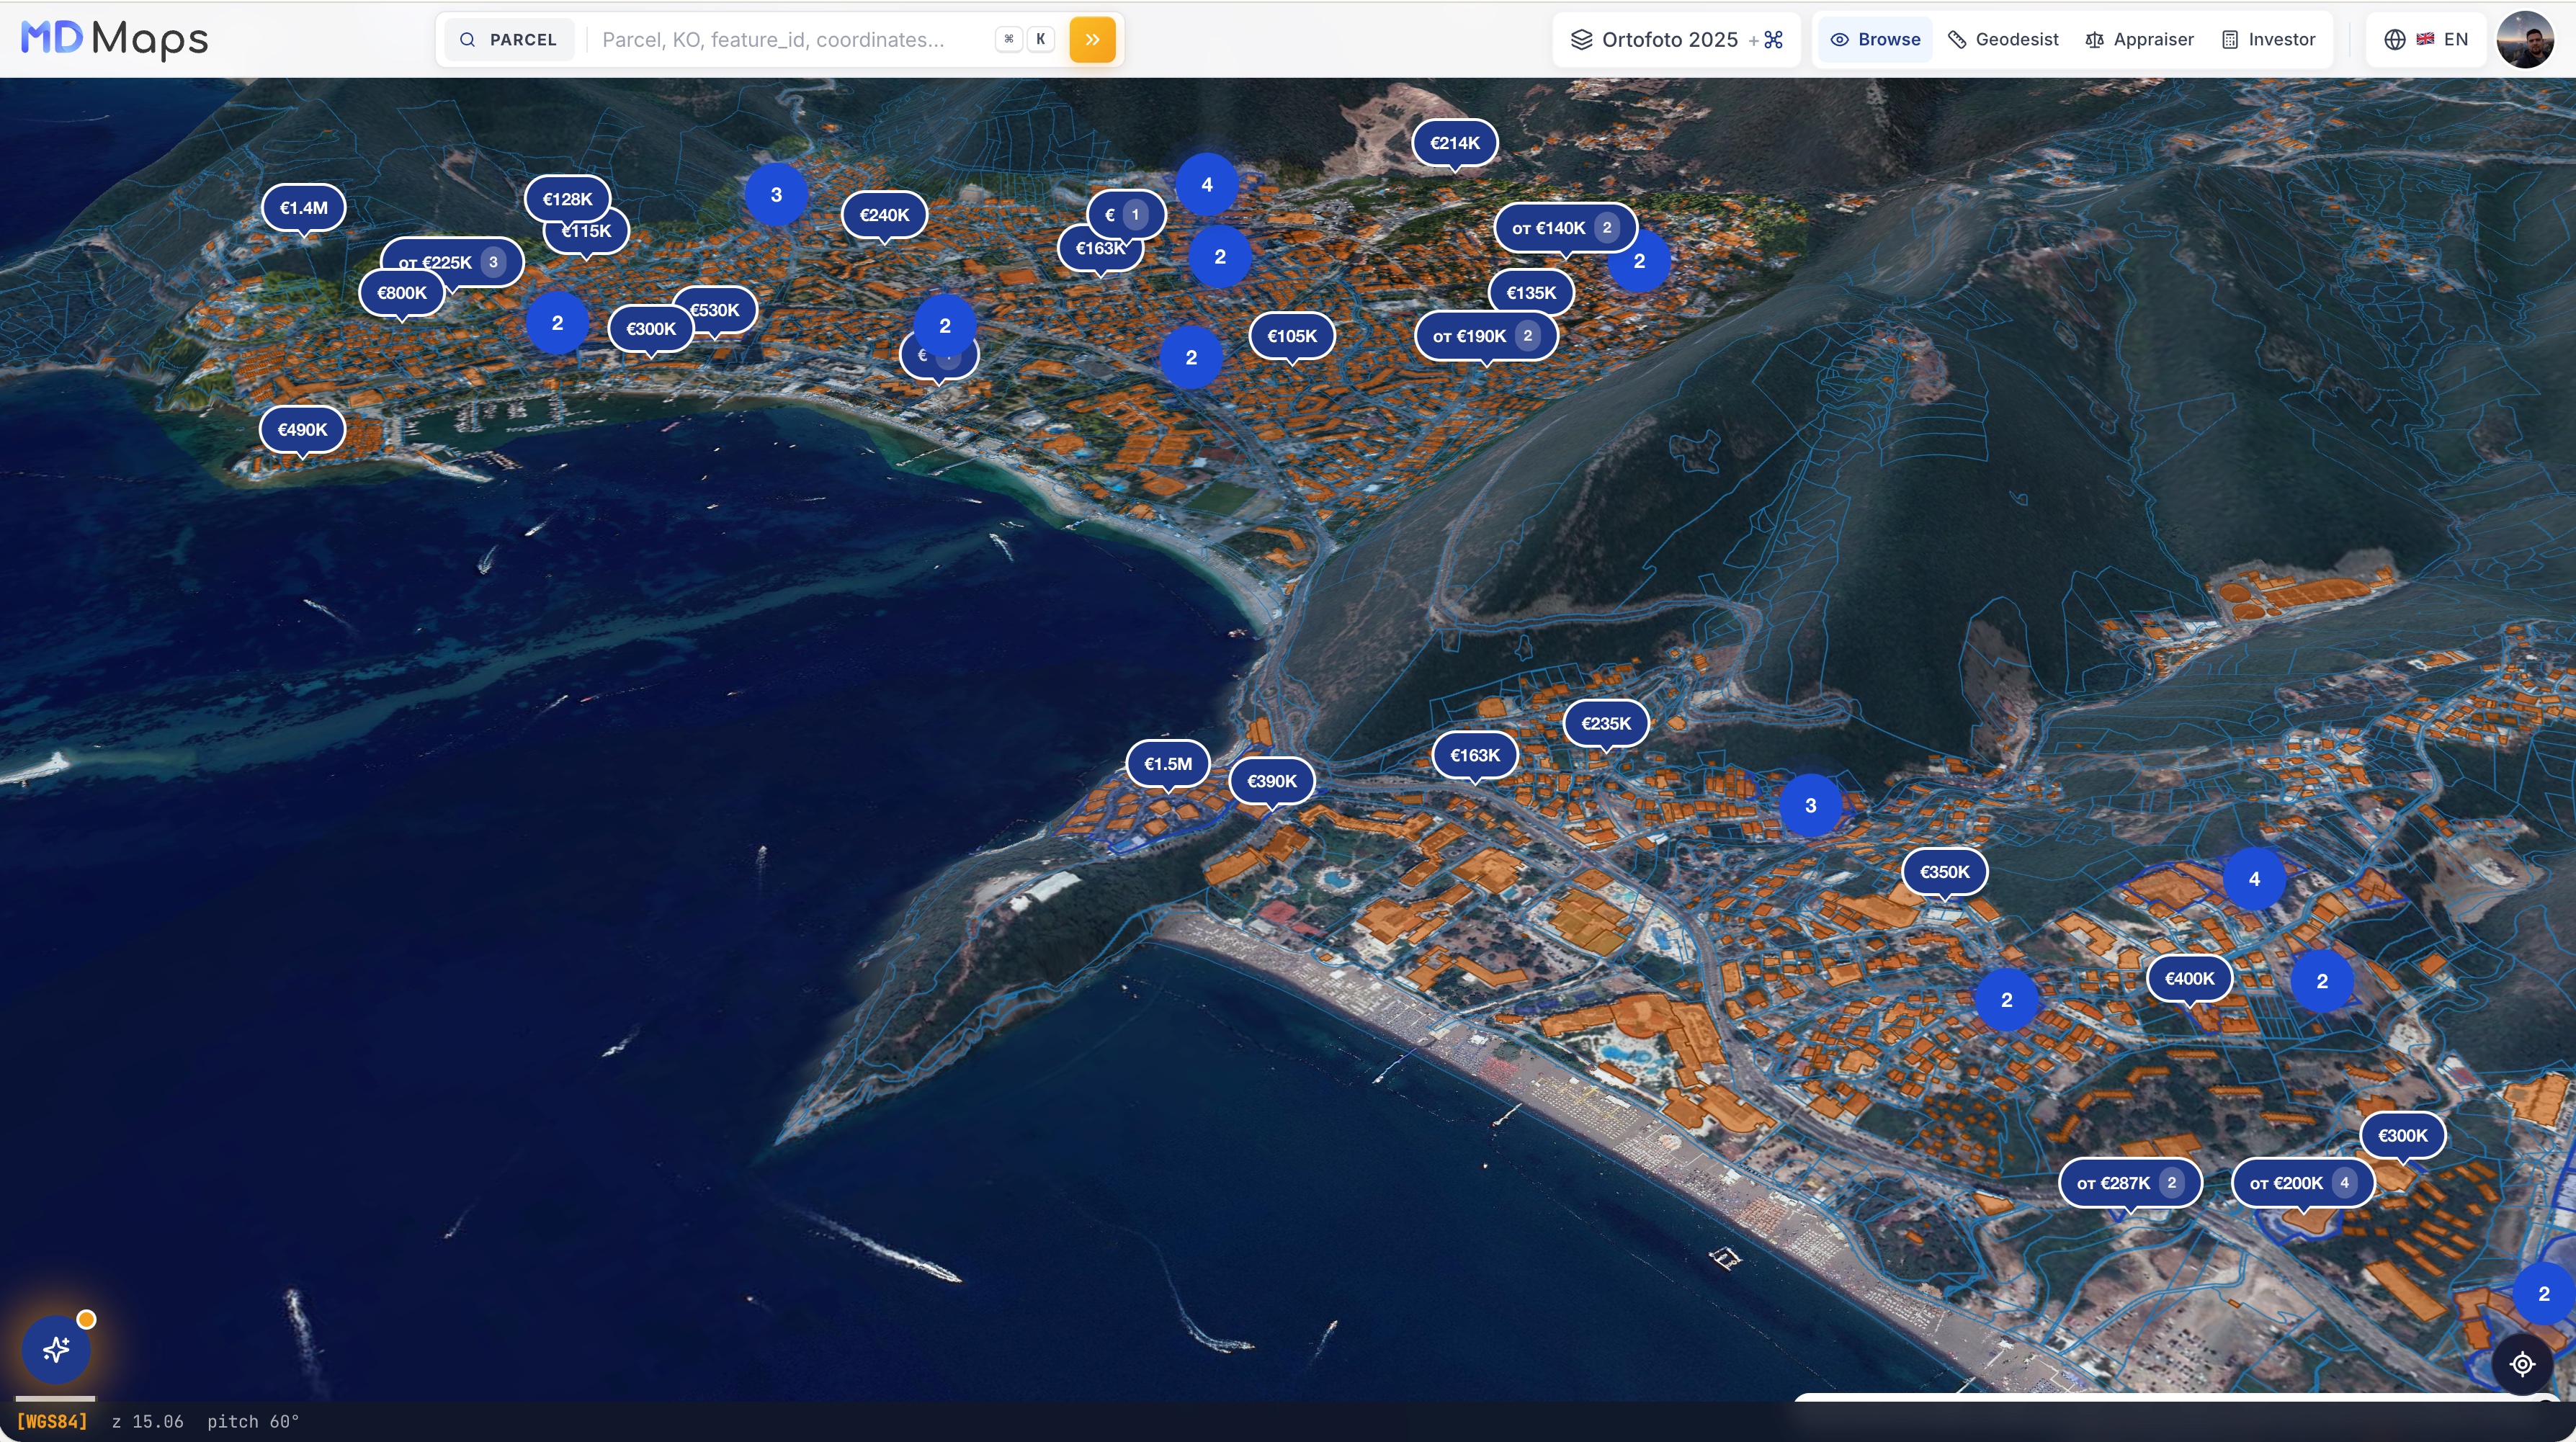
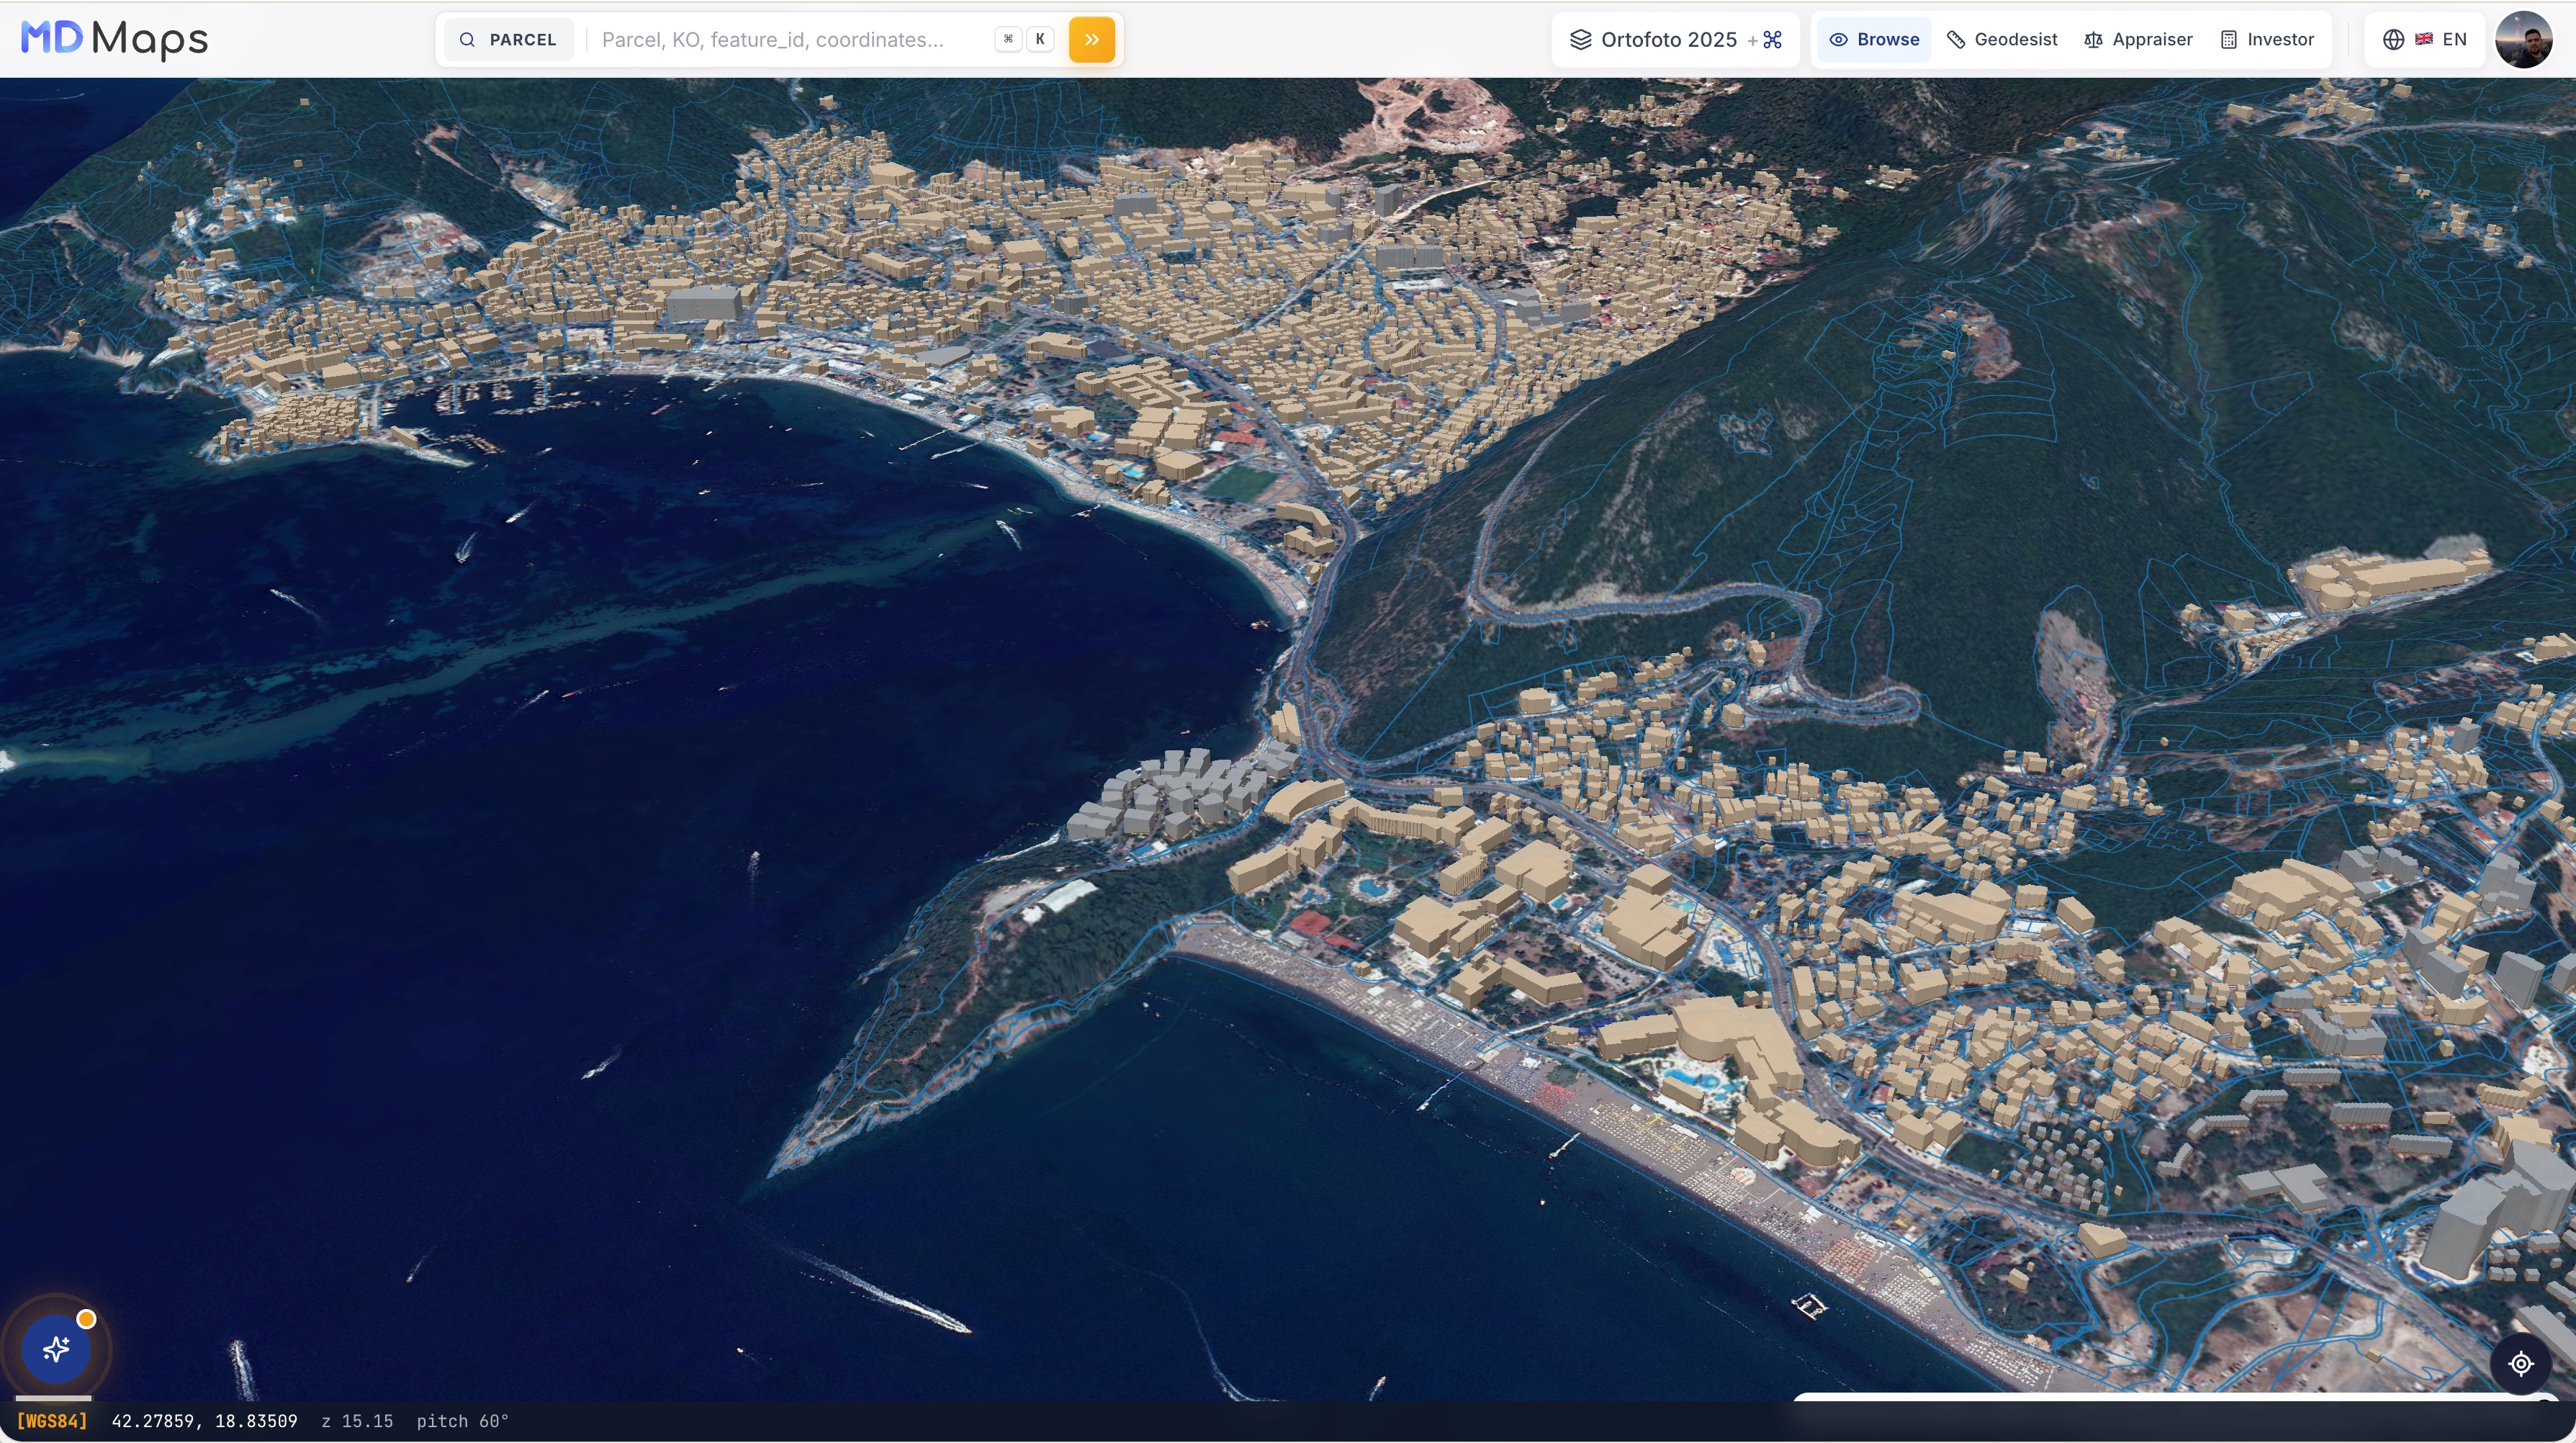
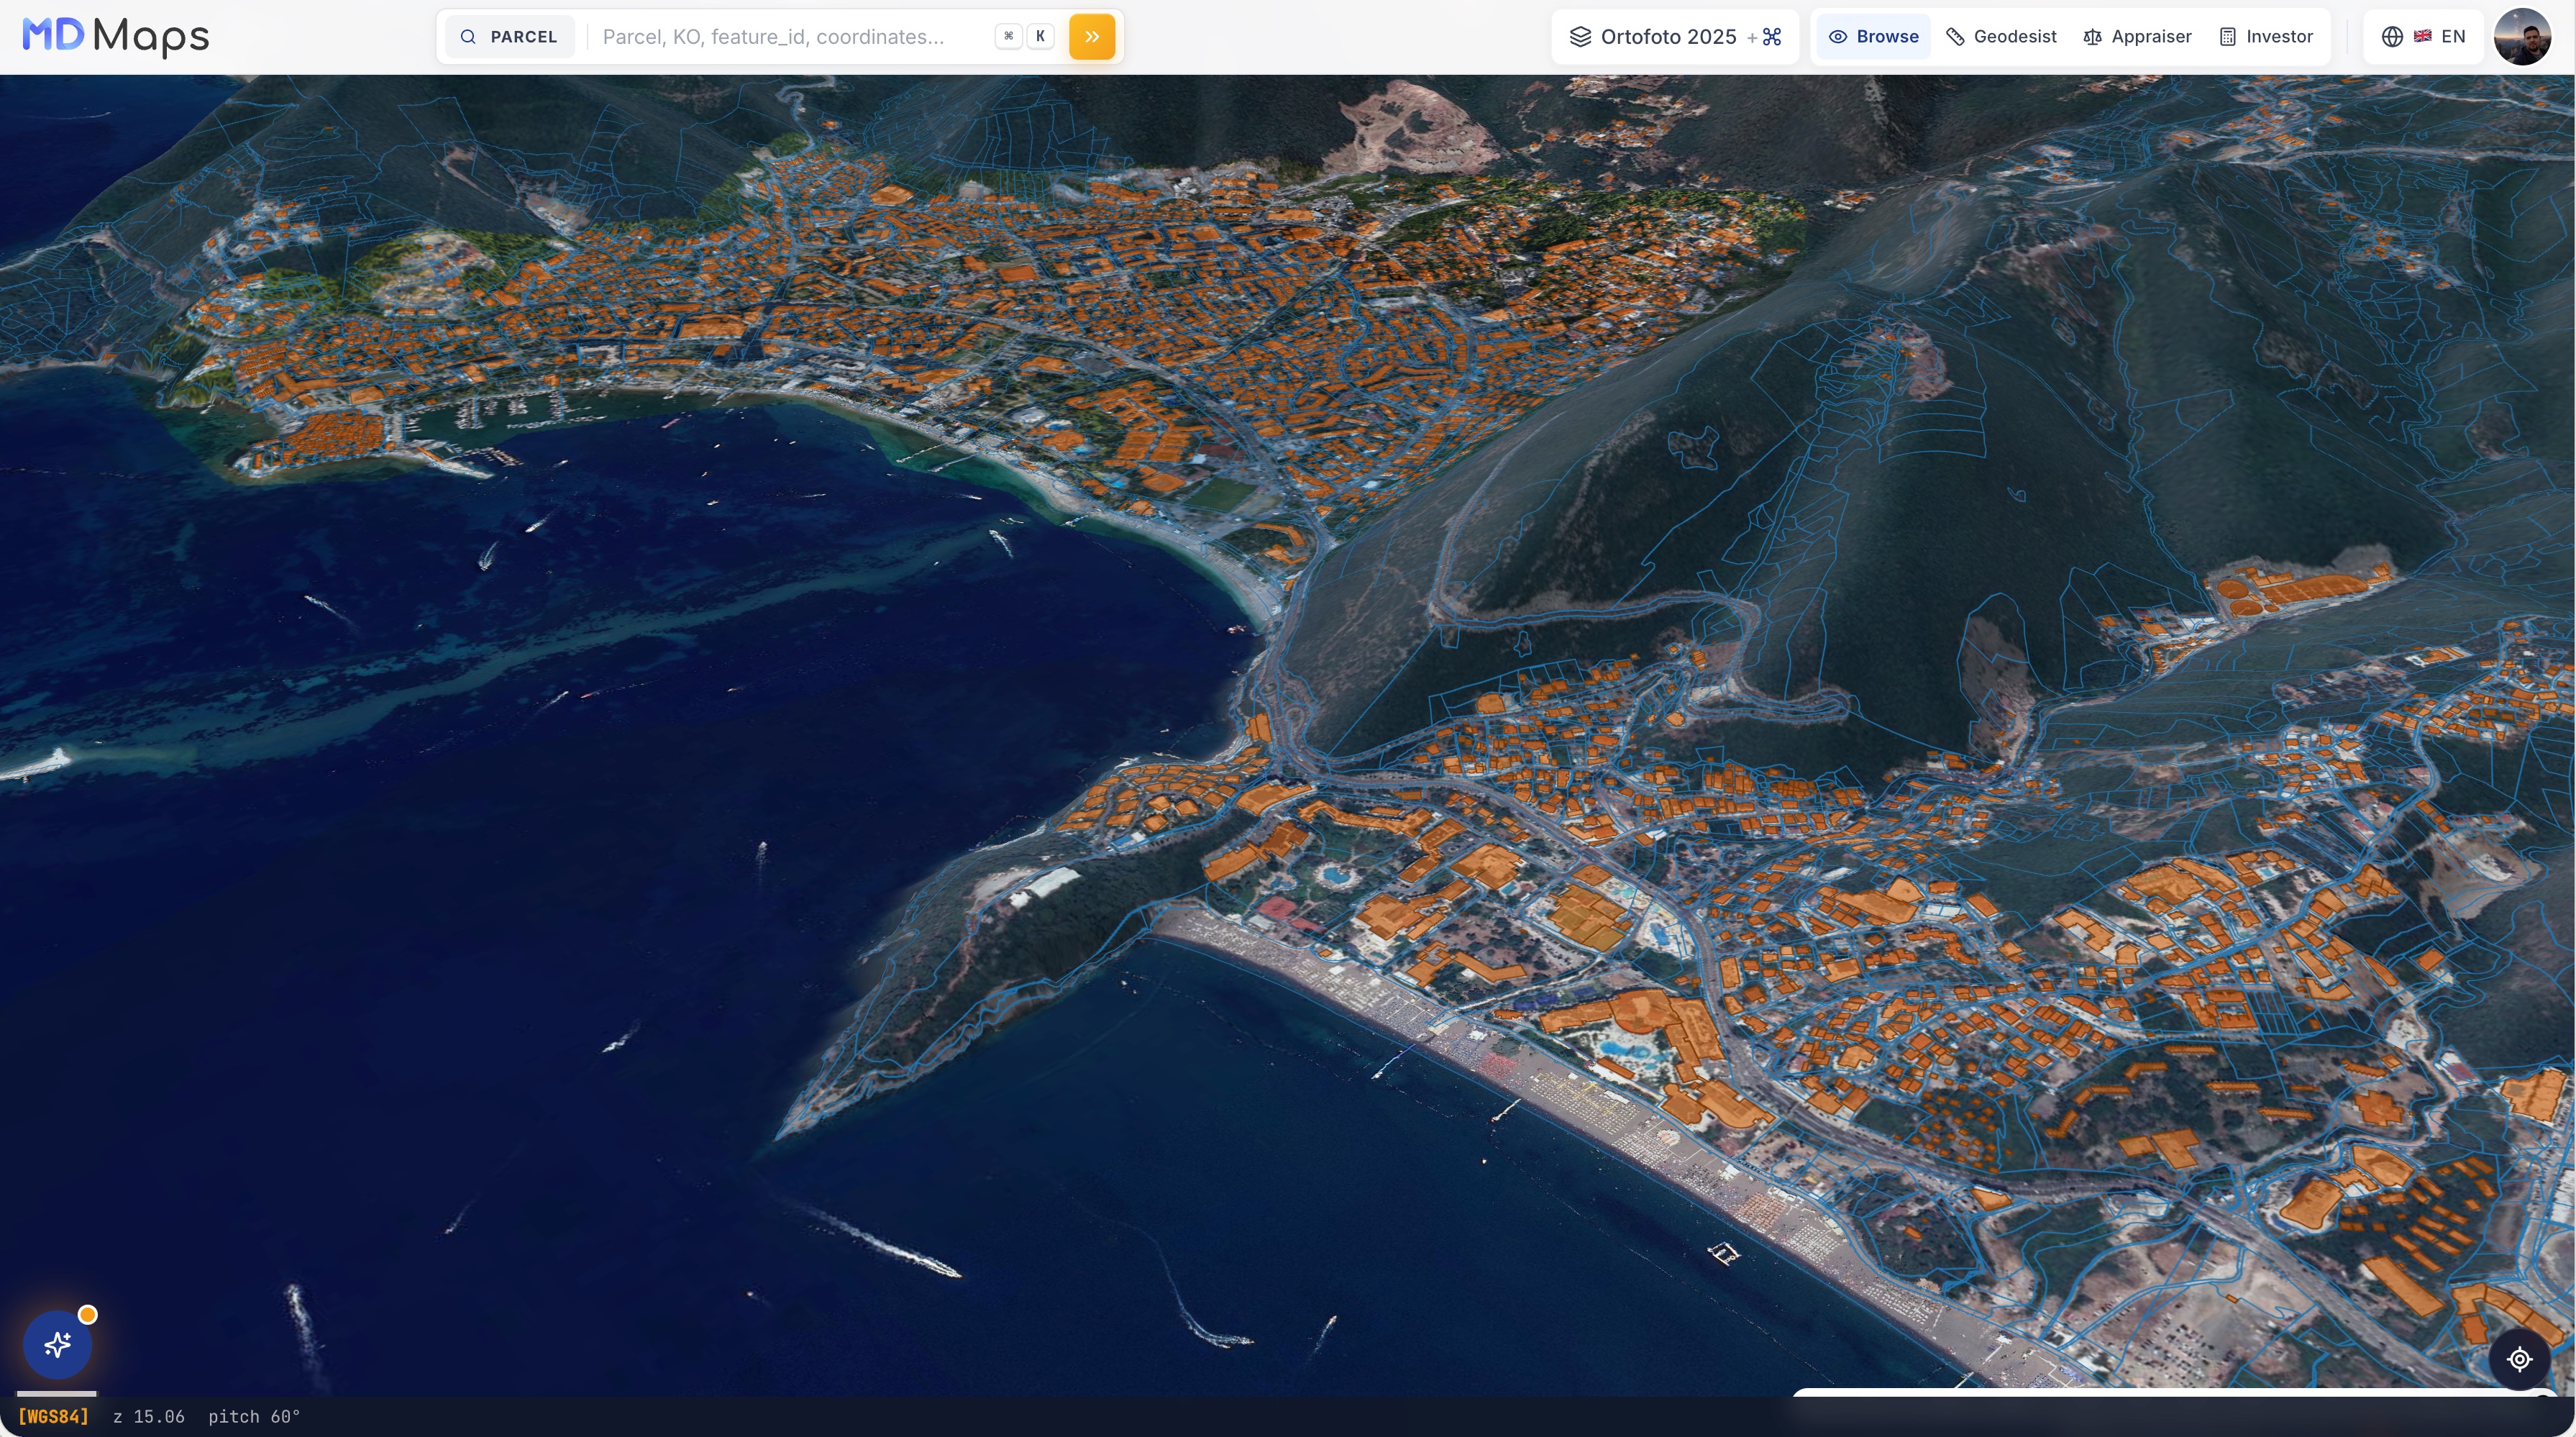
Orthophoto + cadastre
Aerial imagery at 10 cm/pixel with cadastral boundaries overlaid — a precise geo-base for every other layer and measurement.
- Parcel boundaries from eKatastar on top of real imagery
- 10 cm/pixel resolution — every building visible
- A single base frame for prices, analytics and 3D
A full cross-section of a parcel — straight from the state registry
Data is pulled directly from eKatastar.me and served instantly — no intermediaries, only the primary source.
Full cadastral sheet
Sheet number, area, permitted use type, cadastral municipality (opština) and all sub-parcels — the main number and sub-numbers.
Registry of owners
Rights holders with shares (1/1, 1/2, 1/3…), legal grounds (ownership, co-ownership, purchase) and addresses.
Buildings and units
A hierarchy: building → floors → individual units (apartments, parking spots, premises). Jump from owner to apartment and back.
Encumbrances (tereti)
Mortgages, liens and court notes appear in a dedicated section right inside the parcel card.
Official extract
Request a certified extract from eKatastar straight from the interface — PREPIS, IZVOD and PDF formats, no visit to the registry website.
Every co-owner of large properties
For buildings with 200+ apartments we pull data on each rights holder — so not a single unit slips through.
All of it — in a single parcel card
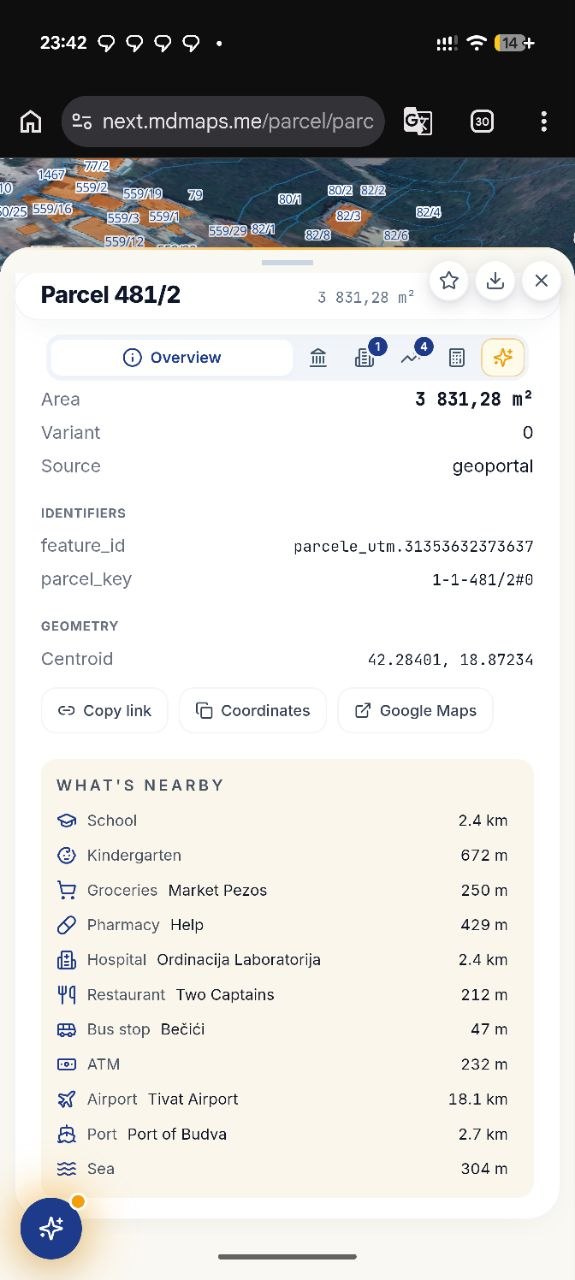
One click on a parcel opens a live card from eKatastar. The tabs cycle on their own; hover to pause and take a look, or click the one you want.
A diagram with real geometry and building outlines, area, cadastral fields, coordinates and quick links to the map and Google Maps.
Parcel 1433/1
Kadastar
Identifiers
parcele_utm.3135…1-3222-1433/1#0Geometry
What's nearby
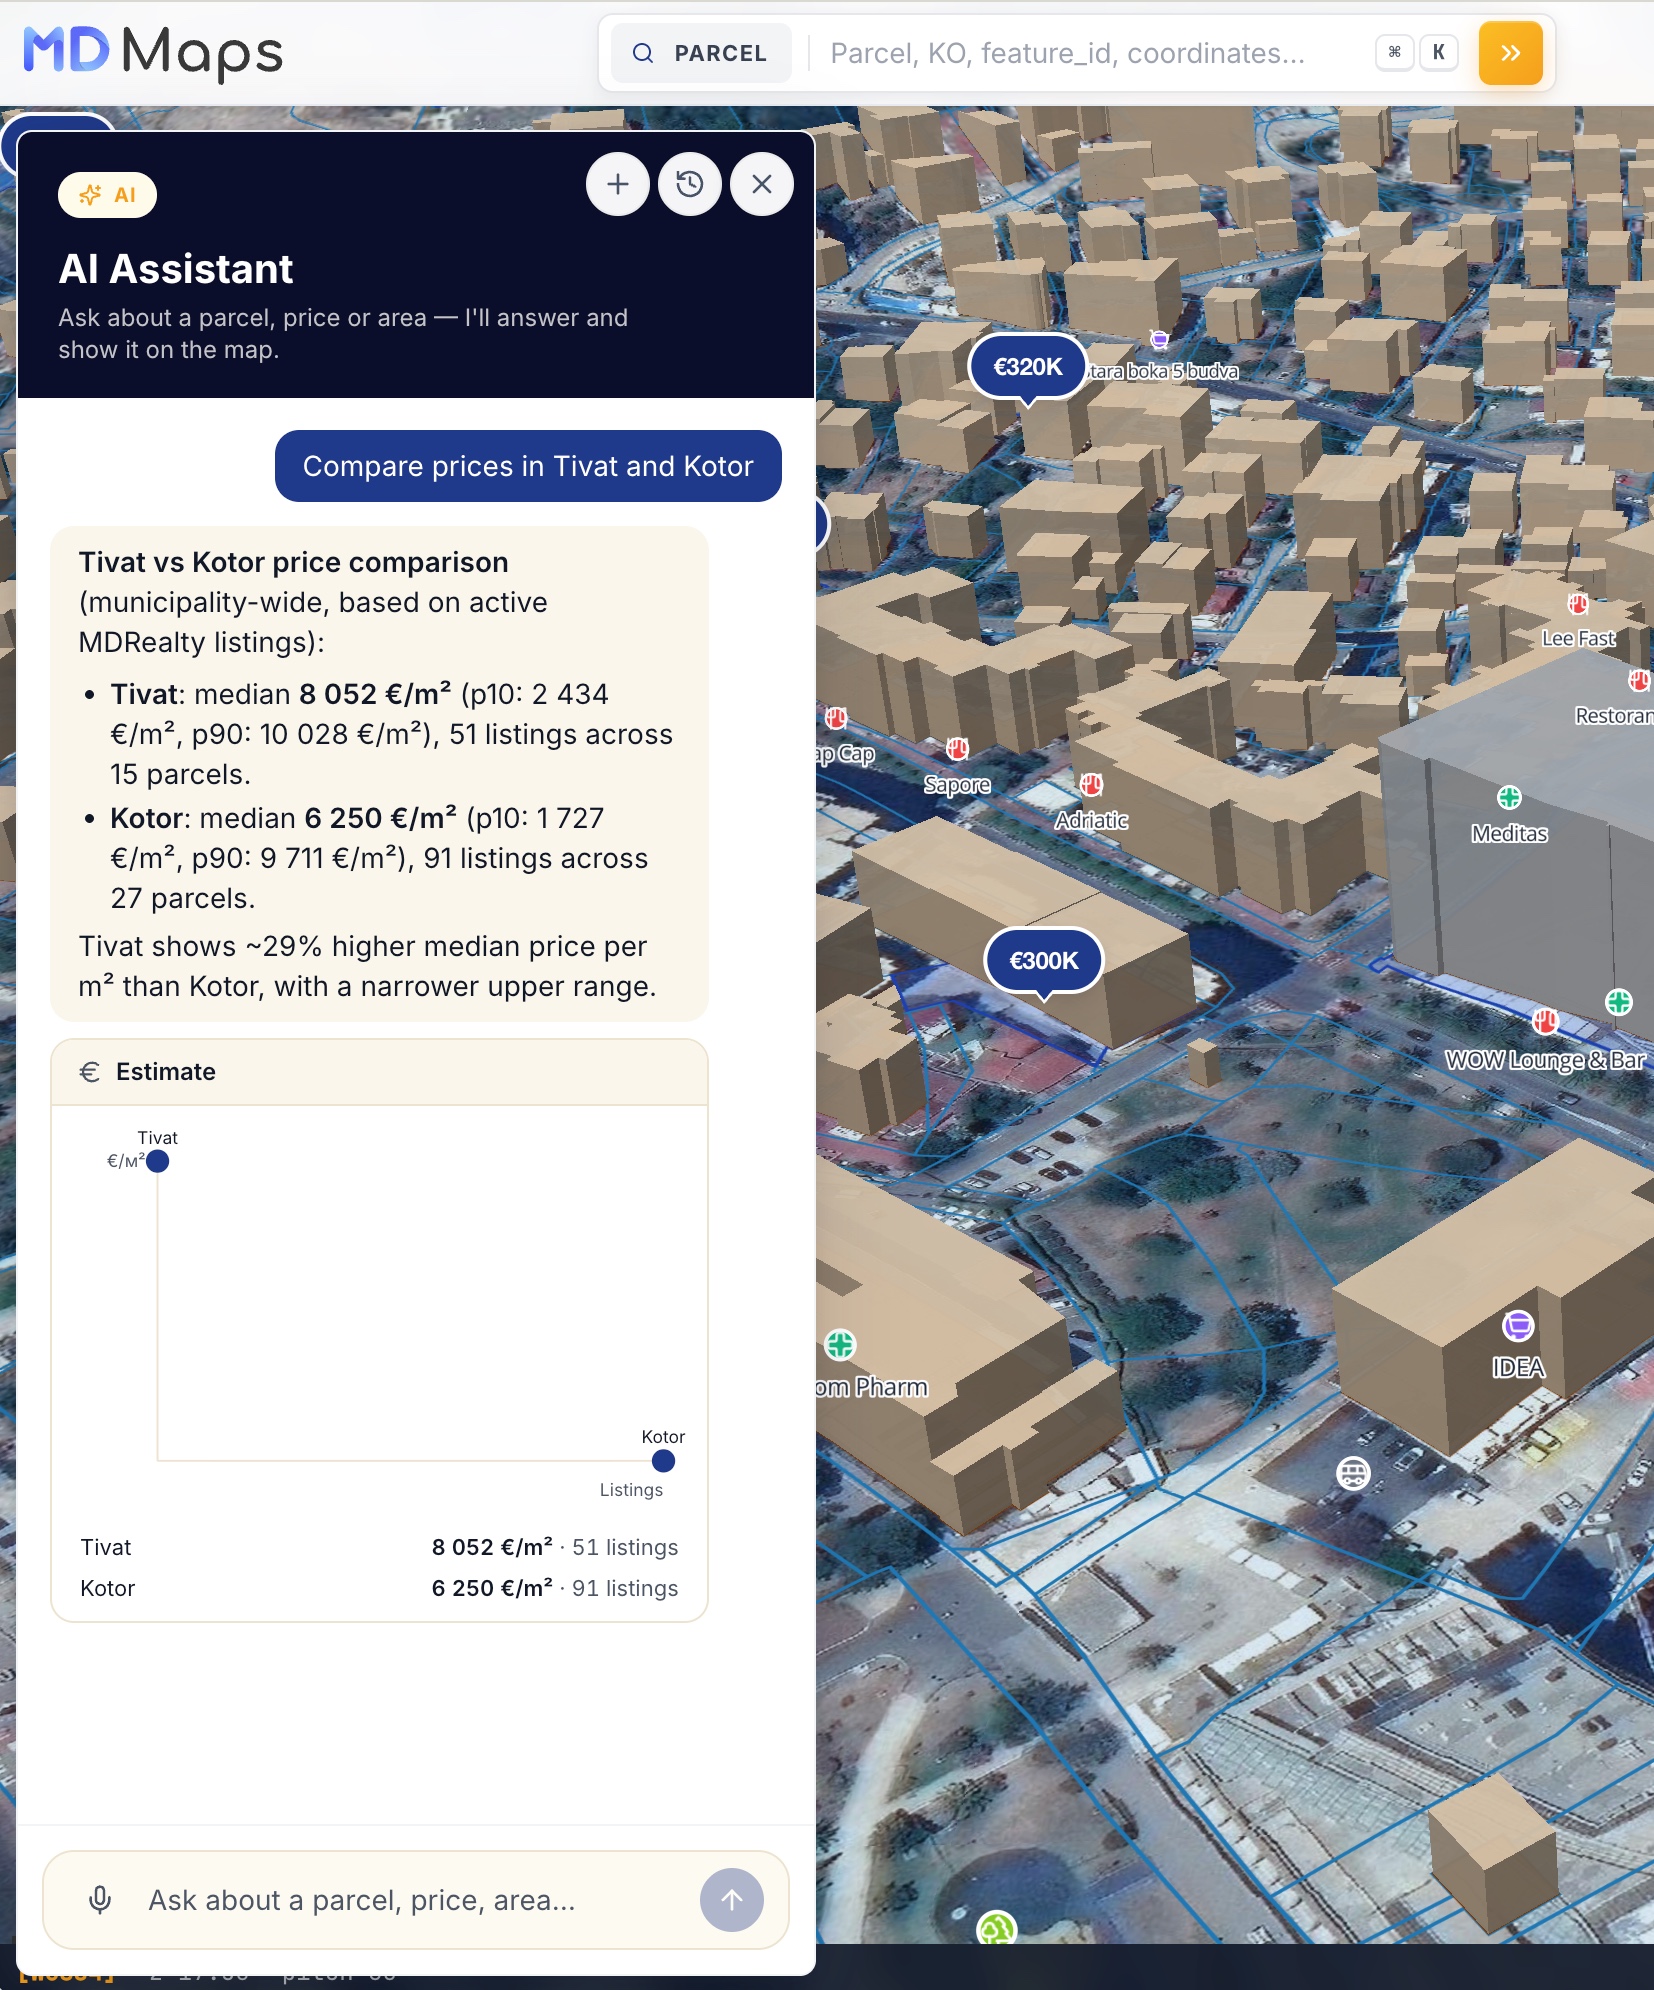
Ask the map in plain language
Search, analysis, advice and encumbrance checks — all in one chat. The answer always links to a specific parcel.
Searches, analyzes, advises, verifies
- Natural-language search: “parcels under €200K by the sea”
- Analysis: “how many 92 m² apartments on the parcel” → an exact PD list
- Neighborhood comparison: “Tivat or Kotor by €/m²” — answered with a chart
- Advice: where it's cheaper, whether it's worth buying at this price
- Encumbrance check: mortgages, liens, status — in a single question
- Voice input and a parcel link in every answer
Professional rendering — and the parcel in seconds
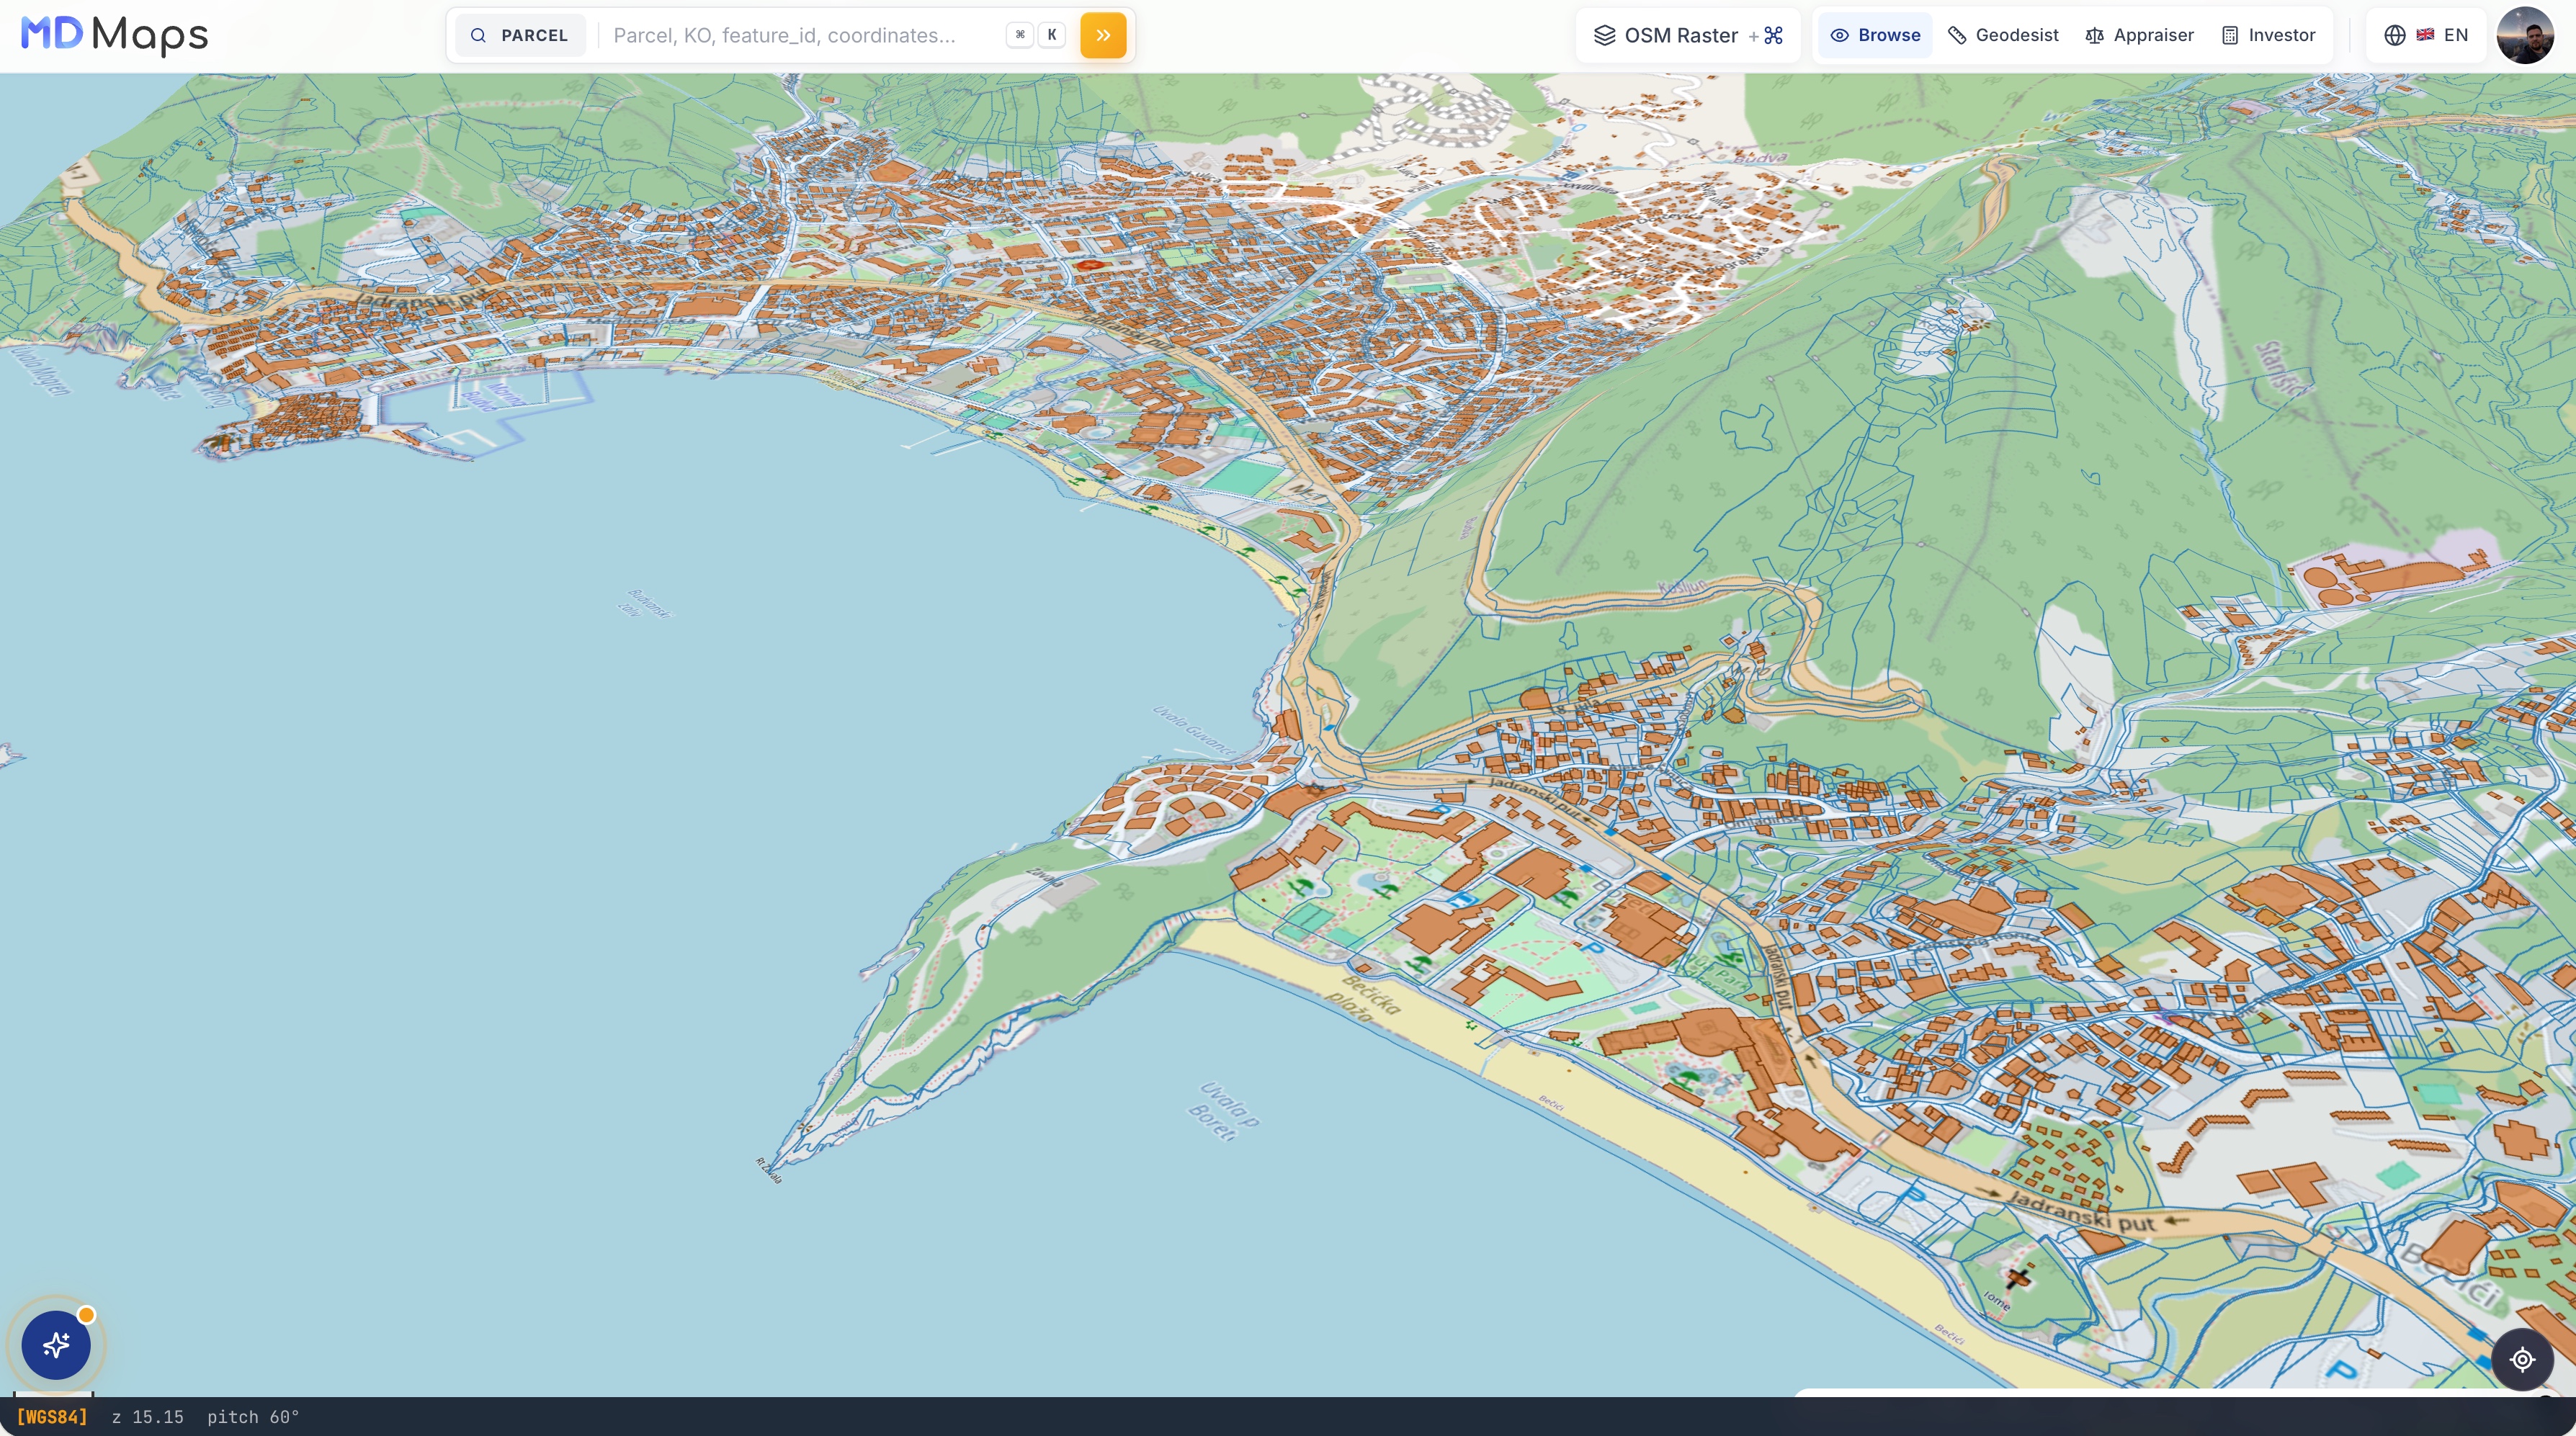
Vector tiles of cadastral boundaries via MapLibre GL from zoom 9, with analytical layers via deck.gl.
- Click a parcel to open its detailed card
- Group-select mode for multiple parcels
- Switch base layers: streets, satellite, orthophoto 2025
- Hotkeys for switching base layers
- Compass and a “find my location” button
- Dark mode — readable in sunlight
- Historical imagery 2007–2018, UAV orthophoto 3 cm, 5 m terrain
Smart search — a command line for the whole country
Instant results with keyboard navigation. Six ways to find what you need.
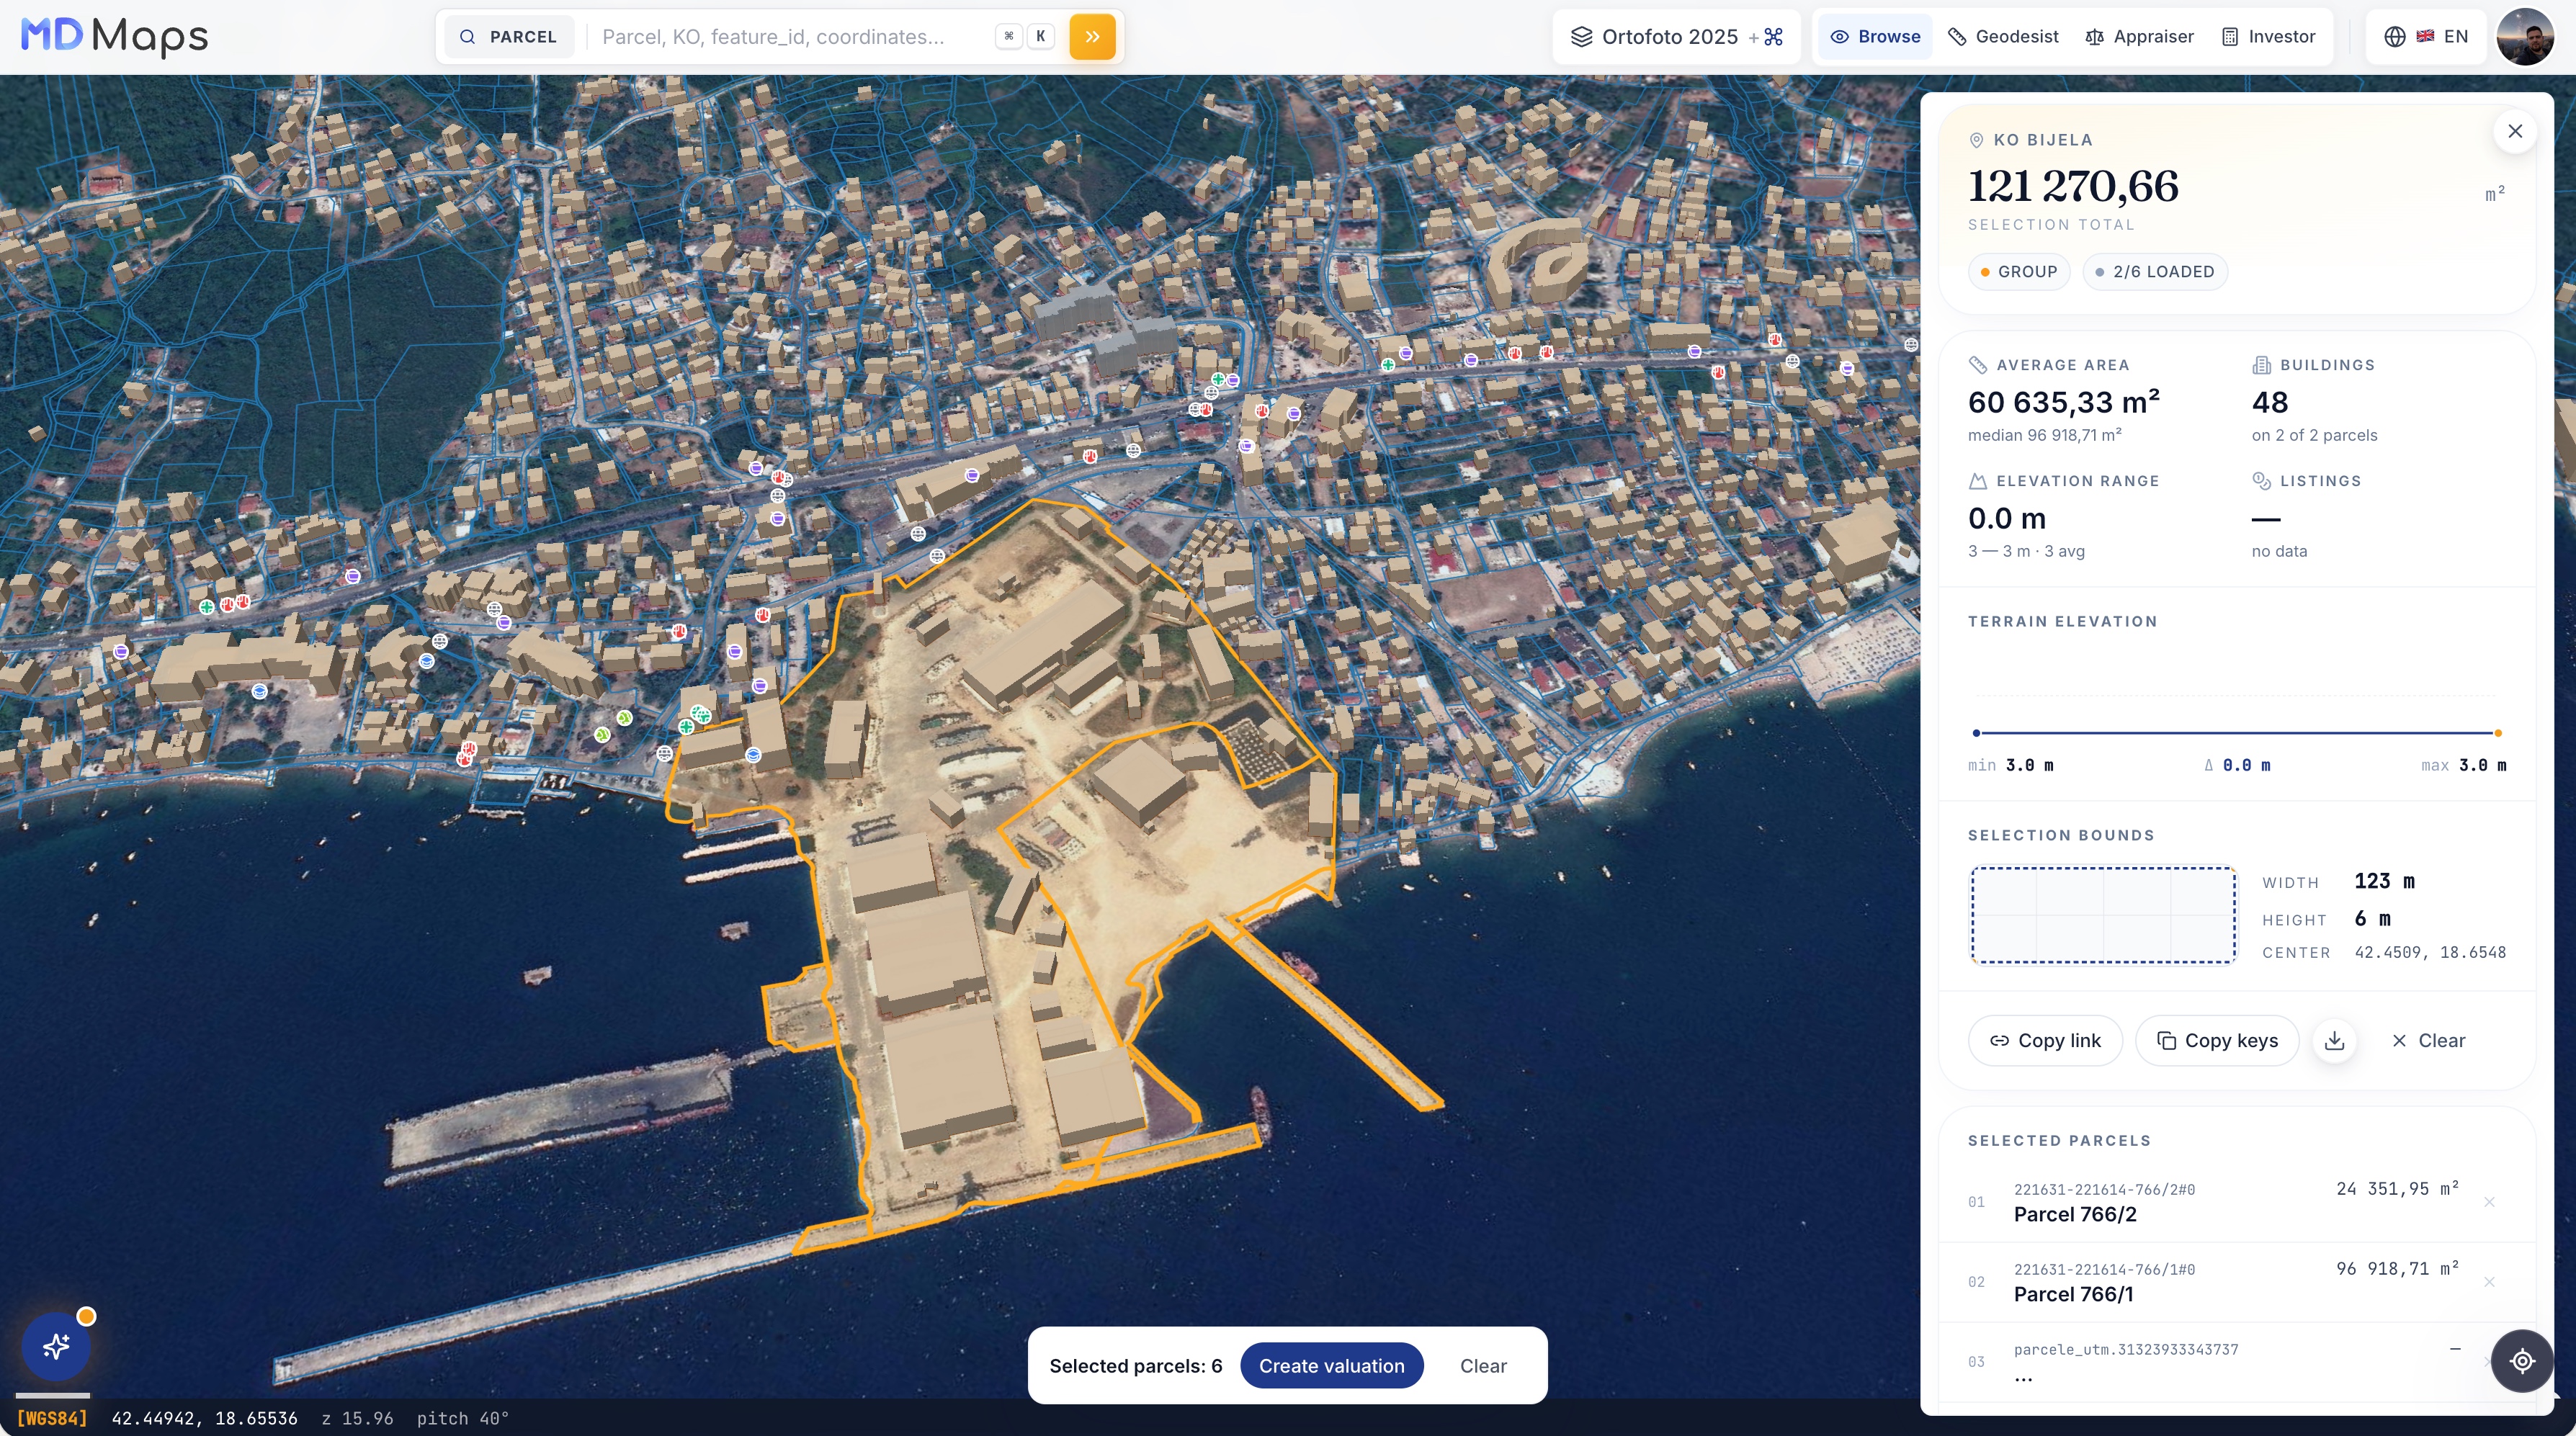
Enter the base number — find the whole group
Searching “463” returns all sub-parcels at once (463/1 … 463/14) with the total area — and computes analytics across the entire selection.
- Total, average and median area of the group
- Buildings, floor counts and listings for the selection
- Terrain elevation profile: min / Δ / max
- Selection dimensions and area distribution
- “All on the map” — highlight the entire group at once
Prices aren't just numbers, they're a decision tool
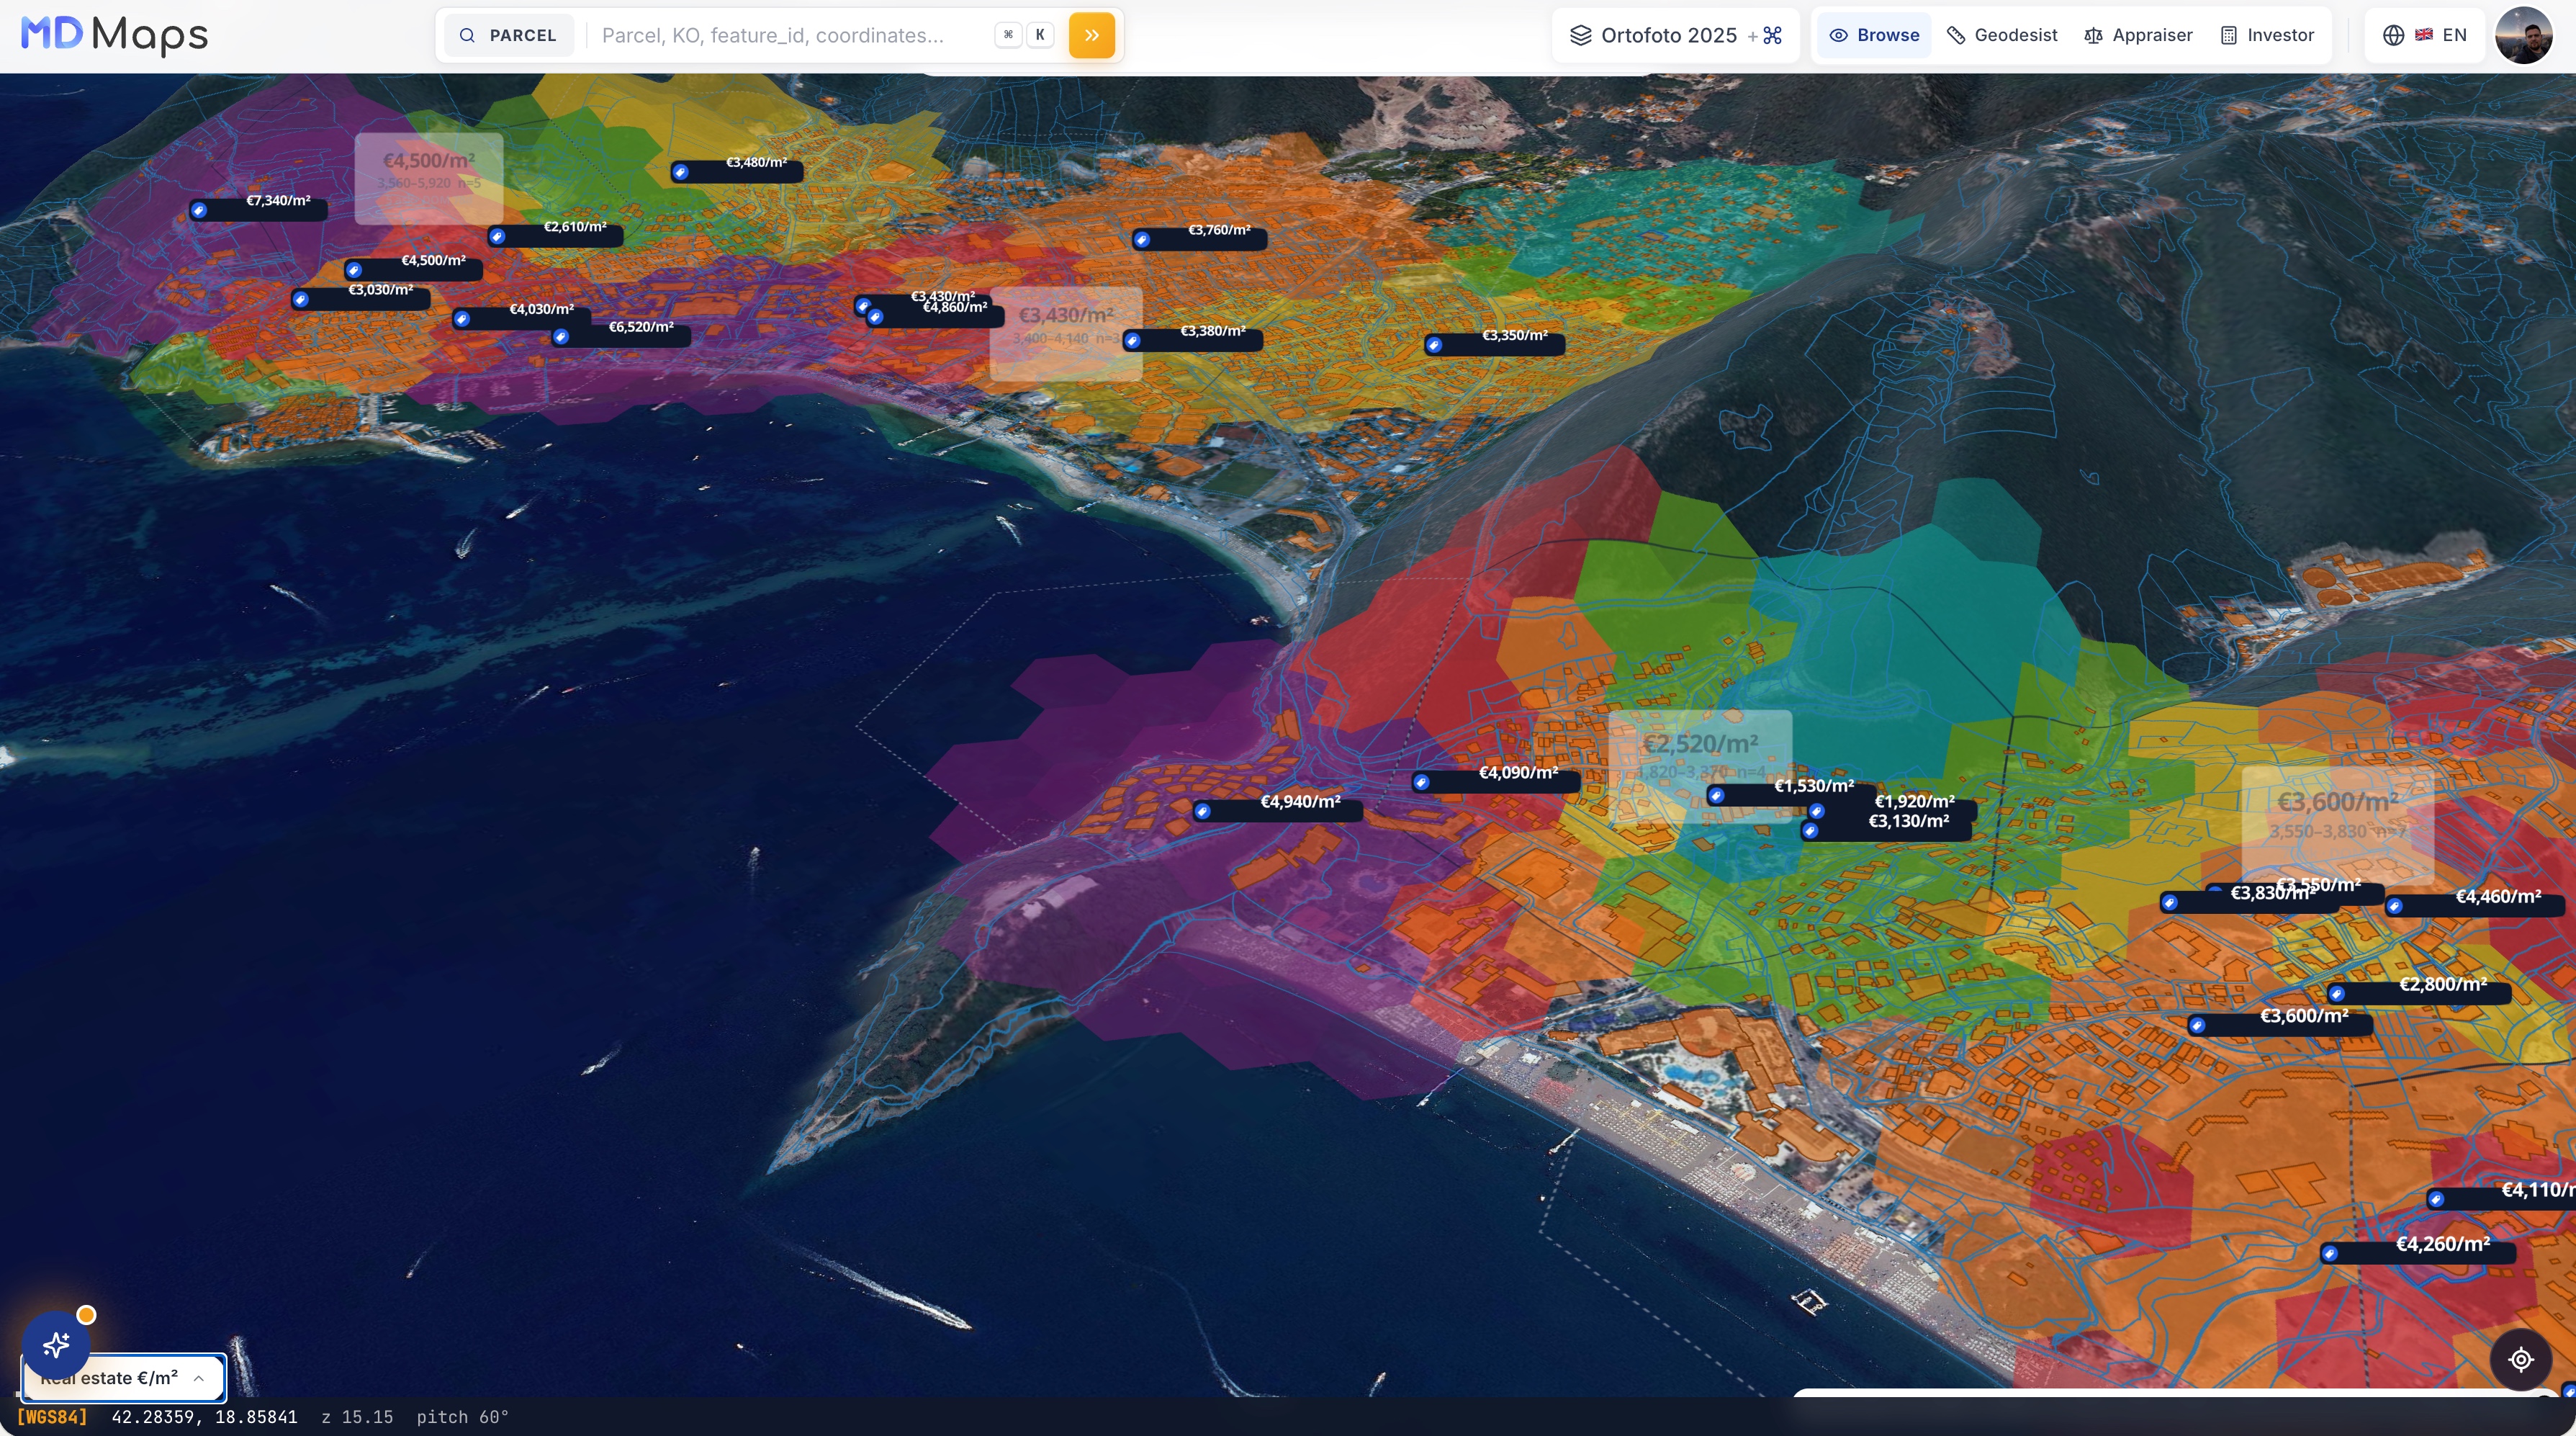
Analytics mode overlays market layers on top of the cadastral map. All in one window.
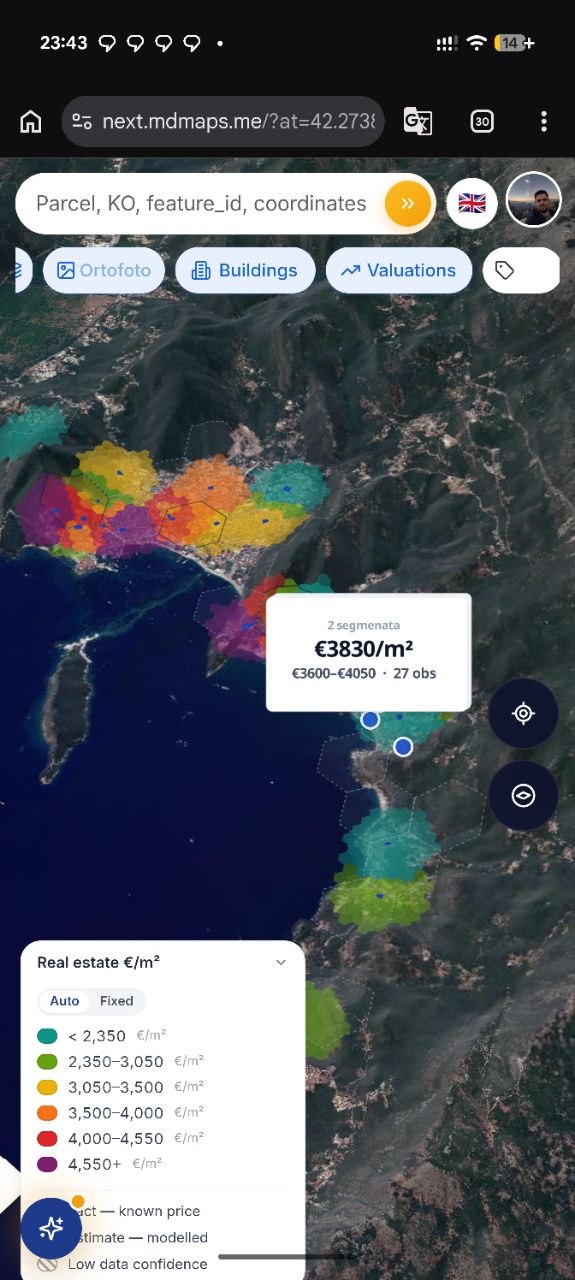
Price heatmap
A deck.gl layer with €/m² color grading across the whole territory — instantly see where it's expensive and why.
Distribution and trends
A histogram and trend sparkline for any selected zone: median, quantiles, outliers.
Forecast and liquidity
A forecast band shows the expected trajectory; the indicator shows how quickly properties sell.
Development potential
A parcel's buildout possibilities based on urban-planning zone data — Urban Buildability.
Comparison with the market
For every listing, an automatic verdict: “X% above or below the neighborhood median.”
Segment filters
Property type, housing class, status (sale / rent / nightly) — analytics recompute instantly.
Is it worth buying? We'll do the math for you
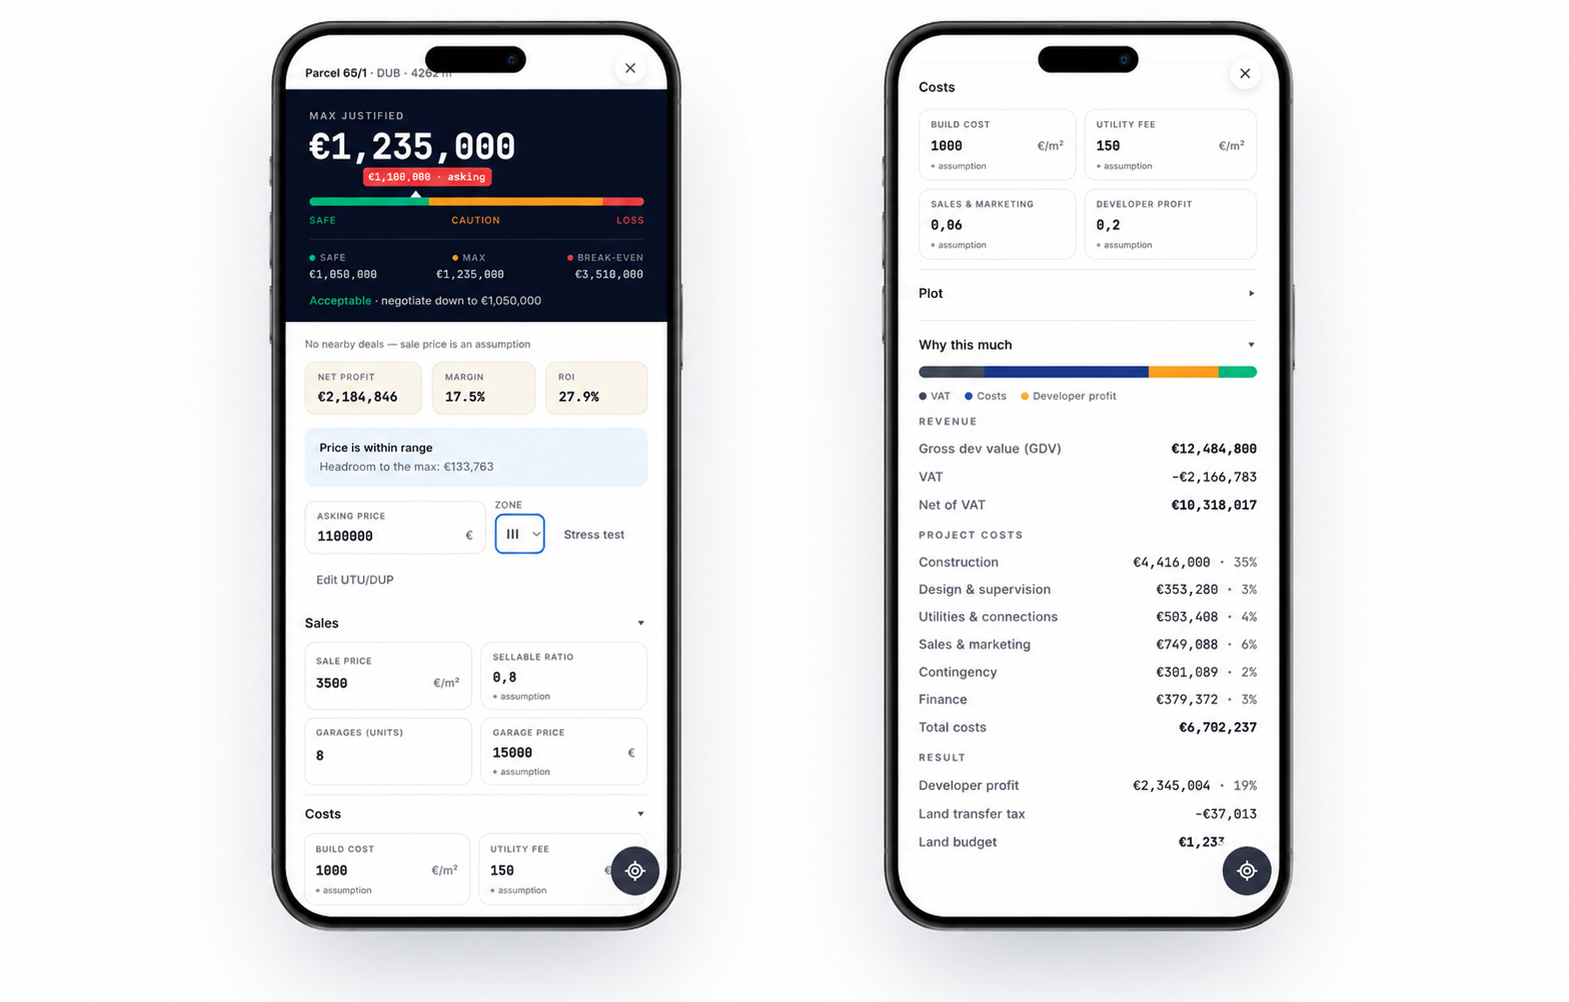
Investor mode turns a parcel into a development model: the maximum justified price, profit, margin and ROI — in seconds, with honest assumptions.
A risk traffic light and a full financial model
- Traffic light SAFE / CAUTION / LOSS relative to the asking price
- Maximum justified price and break-even point, a target for negotiation
- Net profit, margin and project return (ROI)
- A check against the urban-planning zone (I / II / III)
- Full project calculation (GDV): revenue, VAT, construction, marketing, financing
- Residual land budget + a waterfall of “why this much”
- Honestly flags assumptions when there are no nearby deals
A professional's workspace
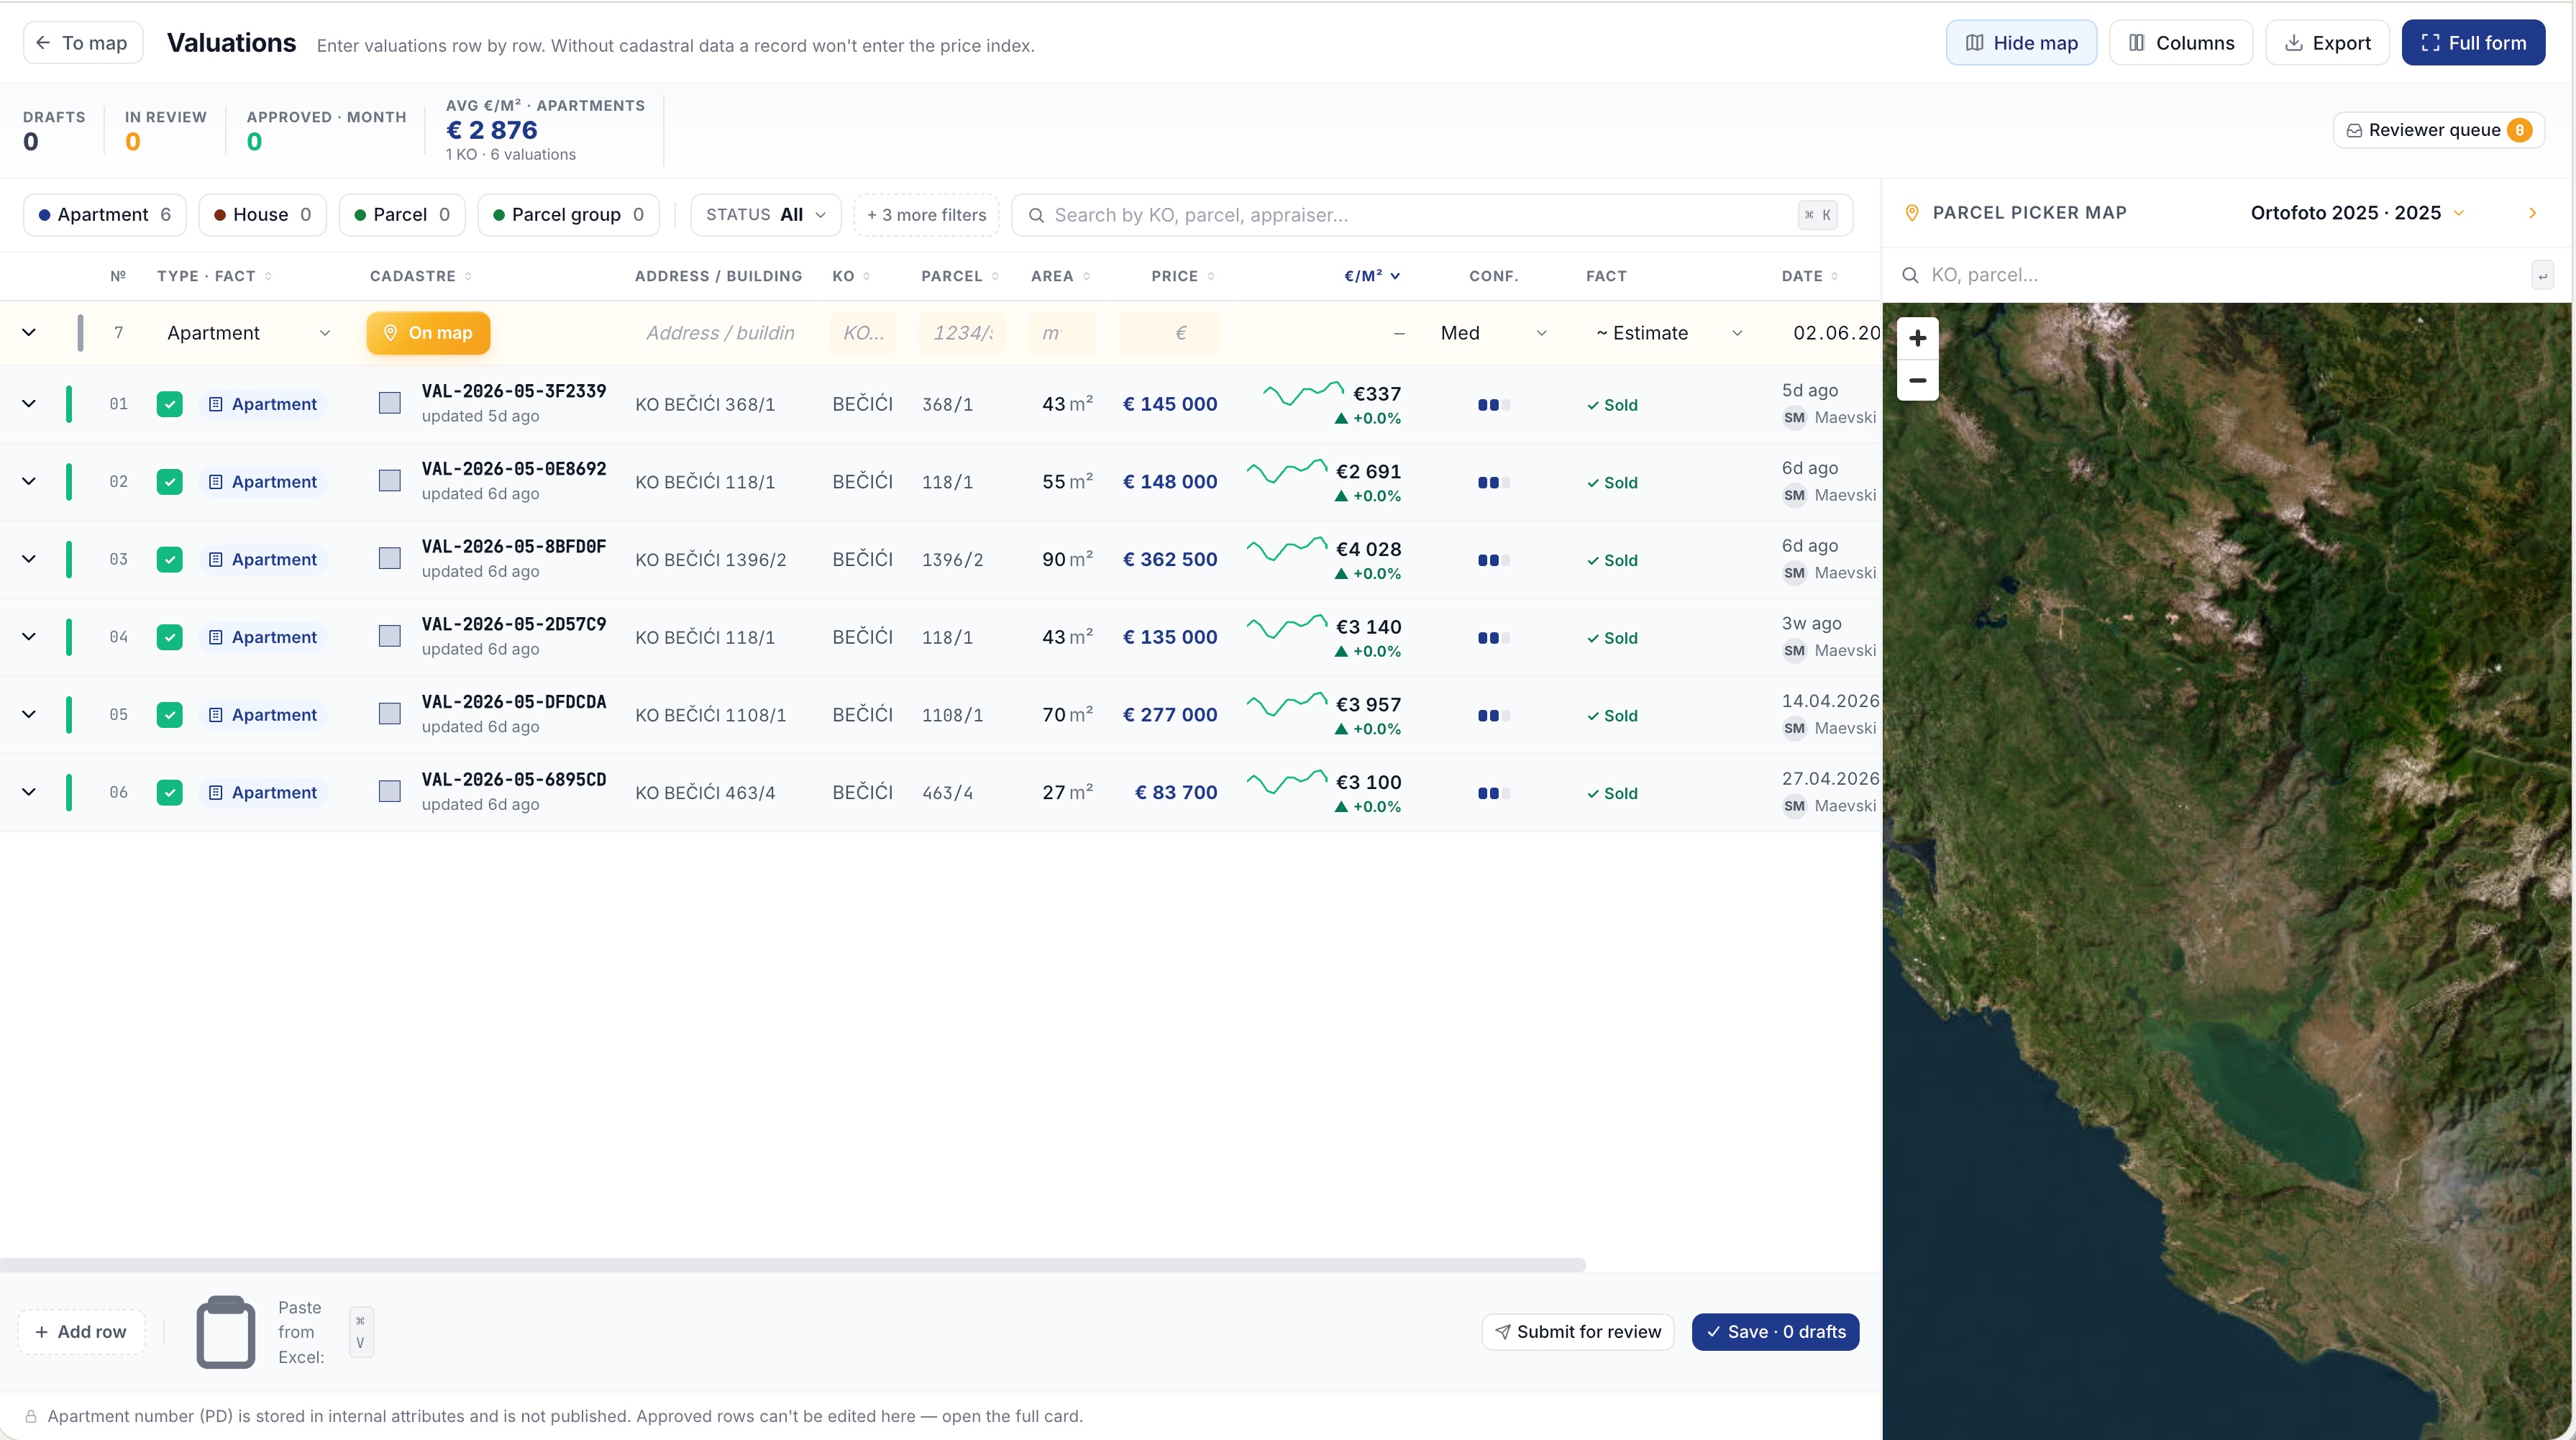
From a field measurement to a valuation report — tools for the people who work with land every day.
A valuation report — from data to PDF
- Create, edit and approve valuation reports
- Pick comps — a table of comparable properties with a map
- Attach files (photos, documents) to a report
- Status history: draft → approved → superseded
- Split view: report on the left, map on the right
- Filters and a grid of all reports by property
Surveyor mode — measurements right on the map
Ruler and elevation profile
Distance, elevation profile and slope between points with WGS84 coordinates.
Area and perimeter
Measure a polygon's area in hectares across any number of points.
Azimuth and stakeout
Azimuth, distance and staking points out in the field. Export and print to PDF.
An owner's entire portfolio by JMBG
Enter a personal number (JMBG) — and get all of a person's real estate across Montenegro, with coordinates and a jump to each parcel. The search runs across every cadastral municipality (opština) at once.
Designed for fieldwork
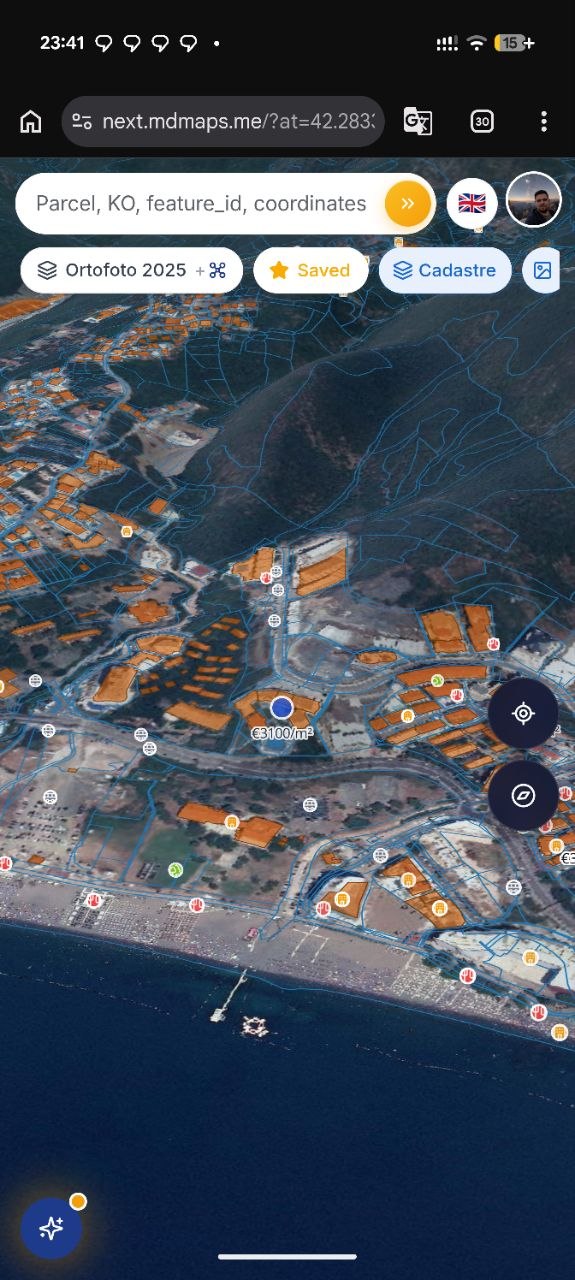
One-handed, in the sun. The whole product, in your phone.
A parcel navigator — in the field and in the car
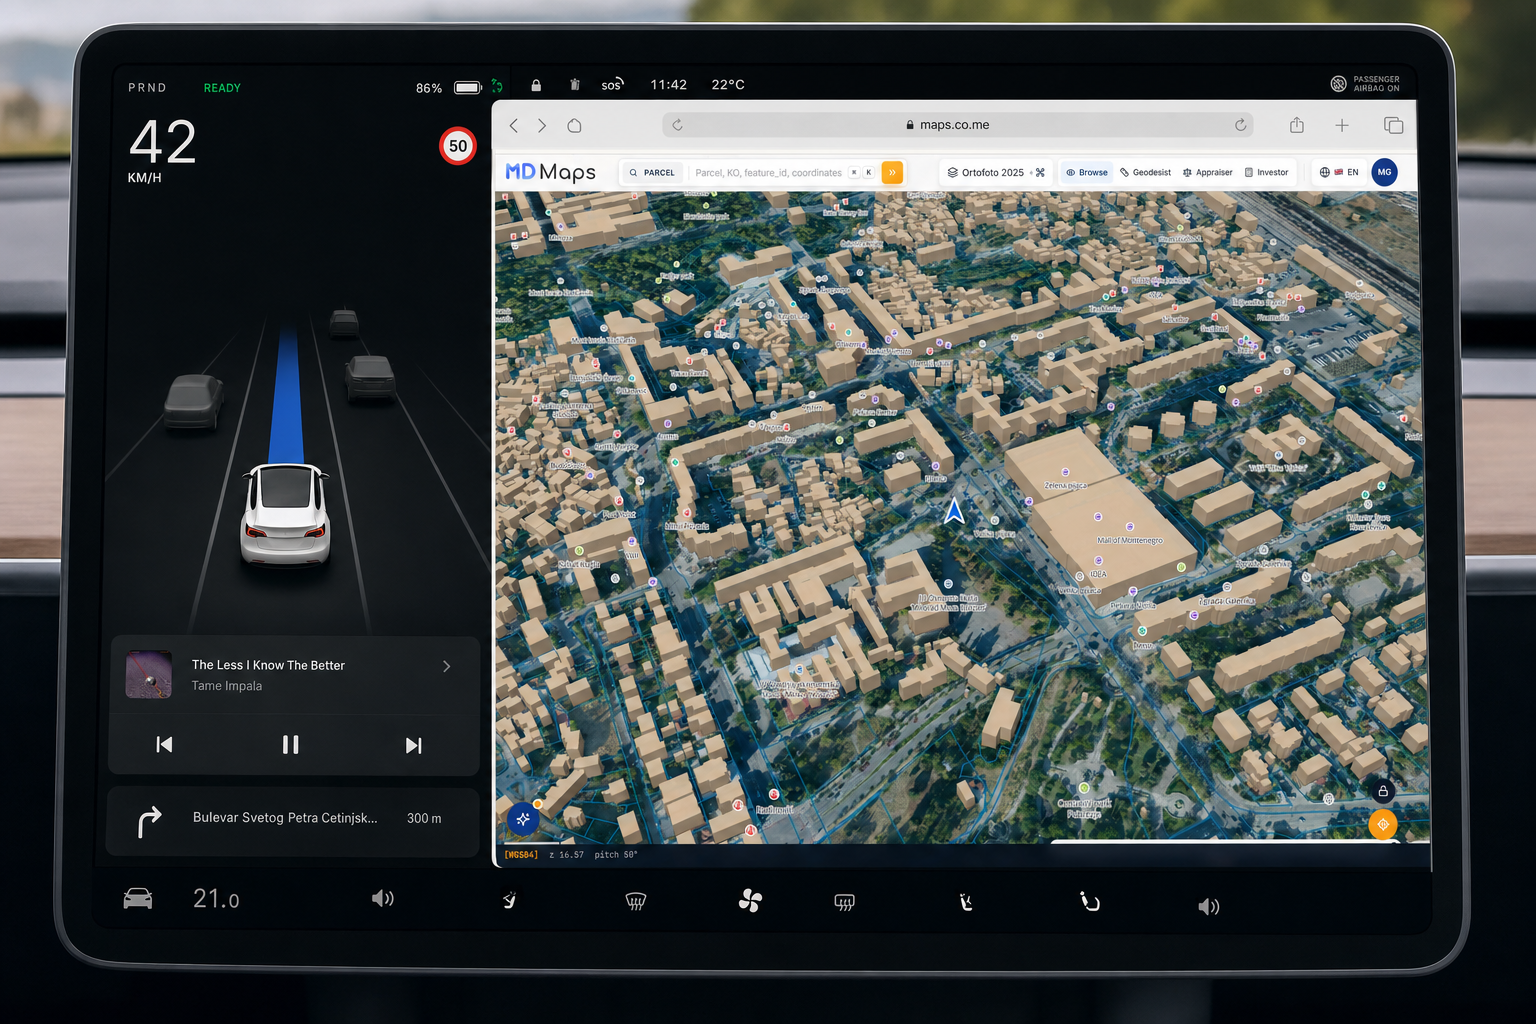
Follow mode guides you across the terrain. Open maps.co.me in your car's browser and get built-in navigation with the cadastre right there.
- Right in the car's browser (Tesla and beyond) — like a built-in navigator
- Follow mode: the map moves with you, the arrow holds your heading
- Turn-by-turn to an address + POIs and parcels all around
- The parcel beneath you, instantly: KO, number, area, status
- Geolocation, compass and cache — even on a weak connection
Embeds into your product three ways
Ready-made solutions for real-estate aggregators — from a widget in an hour to your own layer on your map.
“Market analysis” widget
A signed iframe (~420px): a mini neighborhood map with a heat layer + a verdict like “21% above market.” The HMAC signature is computed on your backend. Localization in ru / me / en / de.
Your own heat layer
Raw price GeoJSON via the API — render it on your own MapLibre map. Full control over styling and interactions.
Deep link to the full map
A single GET to the API returns an MD Maps URL centered on the parcel you need. Drop the link into a listing card — done.
<iframe
  src="https://embed.mdmaps.me/embed/market/mini?partner_id=…&sig=<HMAC>"
  width="100%" height="320"
  style="border:0; border-radius:12px"
  loading="lazy">
</iframe>One platform — different roles
From a surveyor in the field to an investor at a screen — everyone has their own workflow and their own tools.
Surveyor
Works in the field with a phone: FAB geolocation, measurements, an instant tap on a parcel.
Realtor
Checks the owner and encumbrances before a viewing, saves parcels.
Investor
Price heatmap, zone analytics, a parcel's development potential.
Appraiser
Creates and approves reports, picks comps, exports to PDF.
Partner platform
Embeds a widget or a heat layer via the API in a matter of hours.
A solid stack with no excess dependencies
Why the map is fast and stable: a parcel lookup takes under 50 ms, all on proven open technologies. Details below — for partner developers.
PostgreSQL 18 + PostGIS 3.6
Every cadastral polygon in PostGIS. Finding a parcel by point is a single SQL query, ≤ 50 ms.
FastAPI + asyncpg
An async Python backend: every data request is non-blocking, with Swagger out of the box.
Next.js 16 + MapLibre + deck.gl
SSR/ISR for SEO, vector tiles and analytical layers on a professional renderer.
Martin — tile server
Vector tiles of cadastral boundaries served straight from PostGIS.
next-intl · 4 languages
Russian, Montenegrin, English, German — every string in message files, nothing hardcoded.
Access scopes
A public cache with no blocking + premium scopes: live updates, JMBG search, appraiser.
Questions about Montenegro's cadastre
What is MD Maps?
MD Maps is a professional cadastral map of Montenegro: live eKatastar data, market analytics and tools for surveyors, appraisers, agents and investors on one map.
What is eKatastar?
eKatastar is Montenegro's official real-estate cadastre. MD Maps pulls its data directly and shows it on an easy map with analytics on top.
How do I find out who owns a parcel in Montenegro?
Click a parcel on the map — a card opens with the right holders, shares, legal basis and addresses, straight from eKatastar.
Are debts and encumbrances on a parcel shown?
Yes. Mortgages, liens and court notes (tereti) appear in a dedicated section of the parcel card.
How fresh is the data?
Data comes straight from the eKatastar state registry and refreshes on demand with one click; the freshness status is shown on the parcel card.
What languages does MD Maps support?
Four: Russian, Montenegrin, English and German. The map and interface switch completely.
How do I open the map?
Click “Open the map” — it runs in the browser, including on your phone and in a car browser; no sign-up is needed for basic viewing.
Where does the data come from and who is behind the project?
The data source is Montenegro's official cadastre, eKatastar.me. MD Maps is an independent product that adds analytics and tools on top of the primary source. Contact: info@mdbase.me.

A map of Montenegro, ready to work
Open the full map or wire the data into your product — widget, API or deep link.